Dear colleague,

I am pleased to share The Home Performance Gap, Pearl’s latest consumer research report. We wrote it for the professionals who help people buy homes, including agents, brokers, listing platforms, and the organizations that serve them.

In February 2026, we surveyed 833 recent and active homebuyers. Over the summer, we held three focus groups with 18 recent buyers in metro Atlanta, then interviewed ten of them individually. Pearl commissioned and funded the research to guide our own product development. The findings proved useful beyond those decisions, so we’re publishing them. What follows is my own reading of the results.

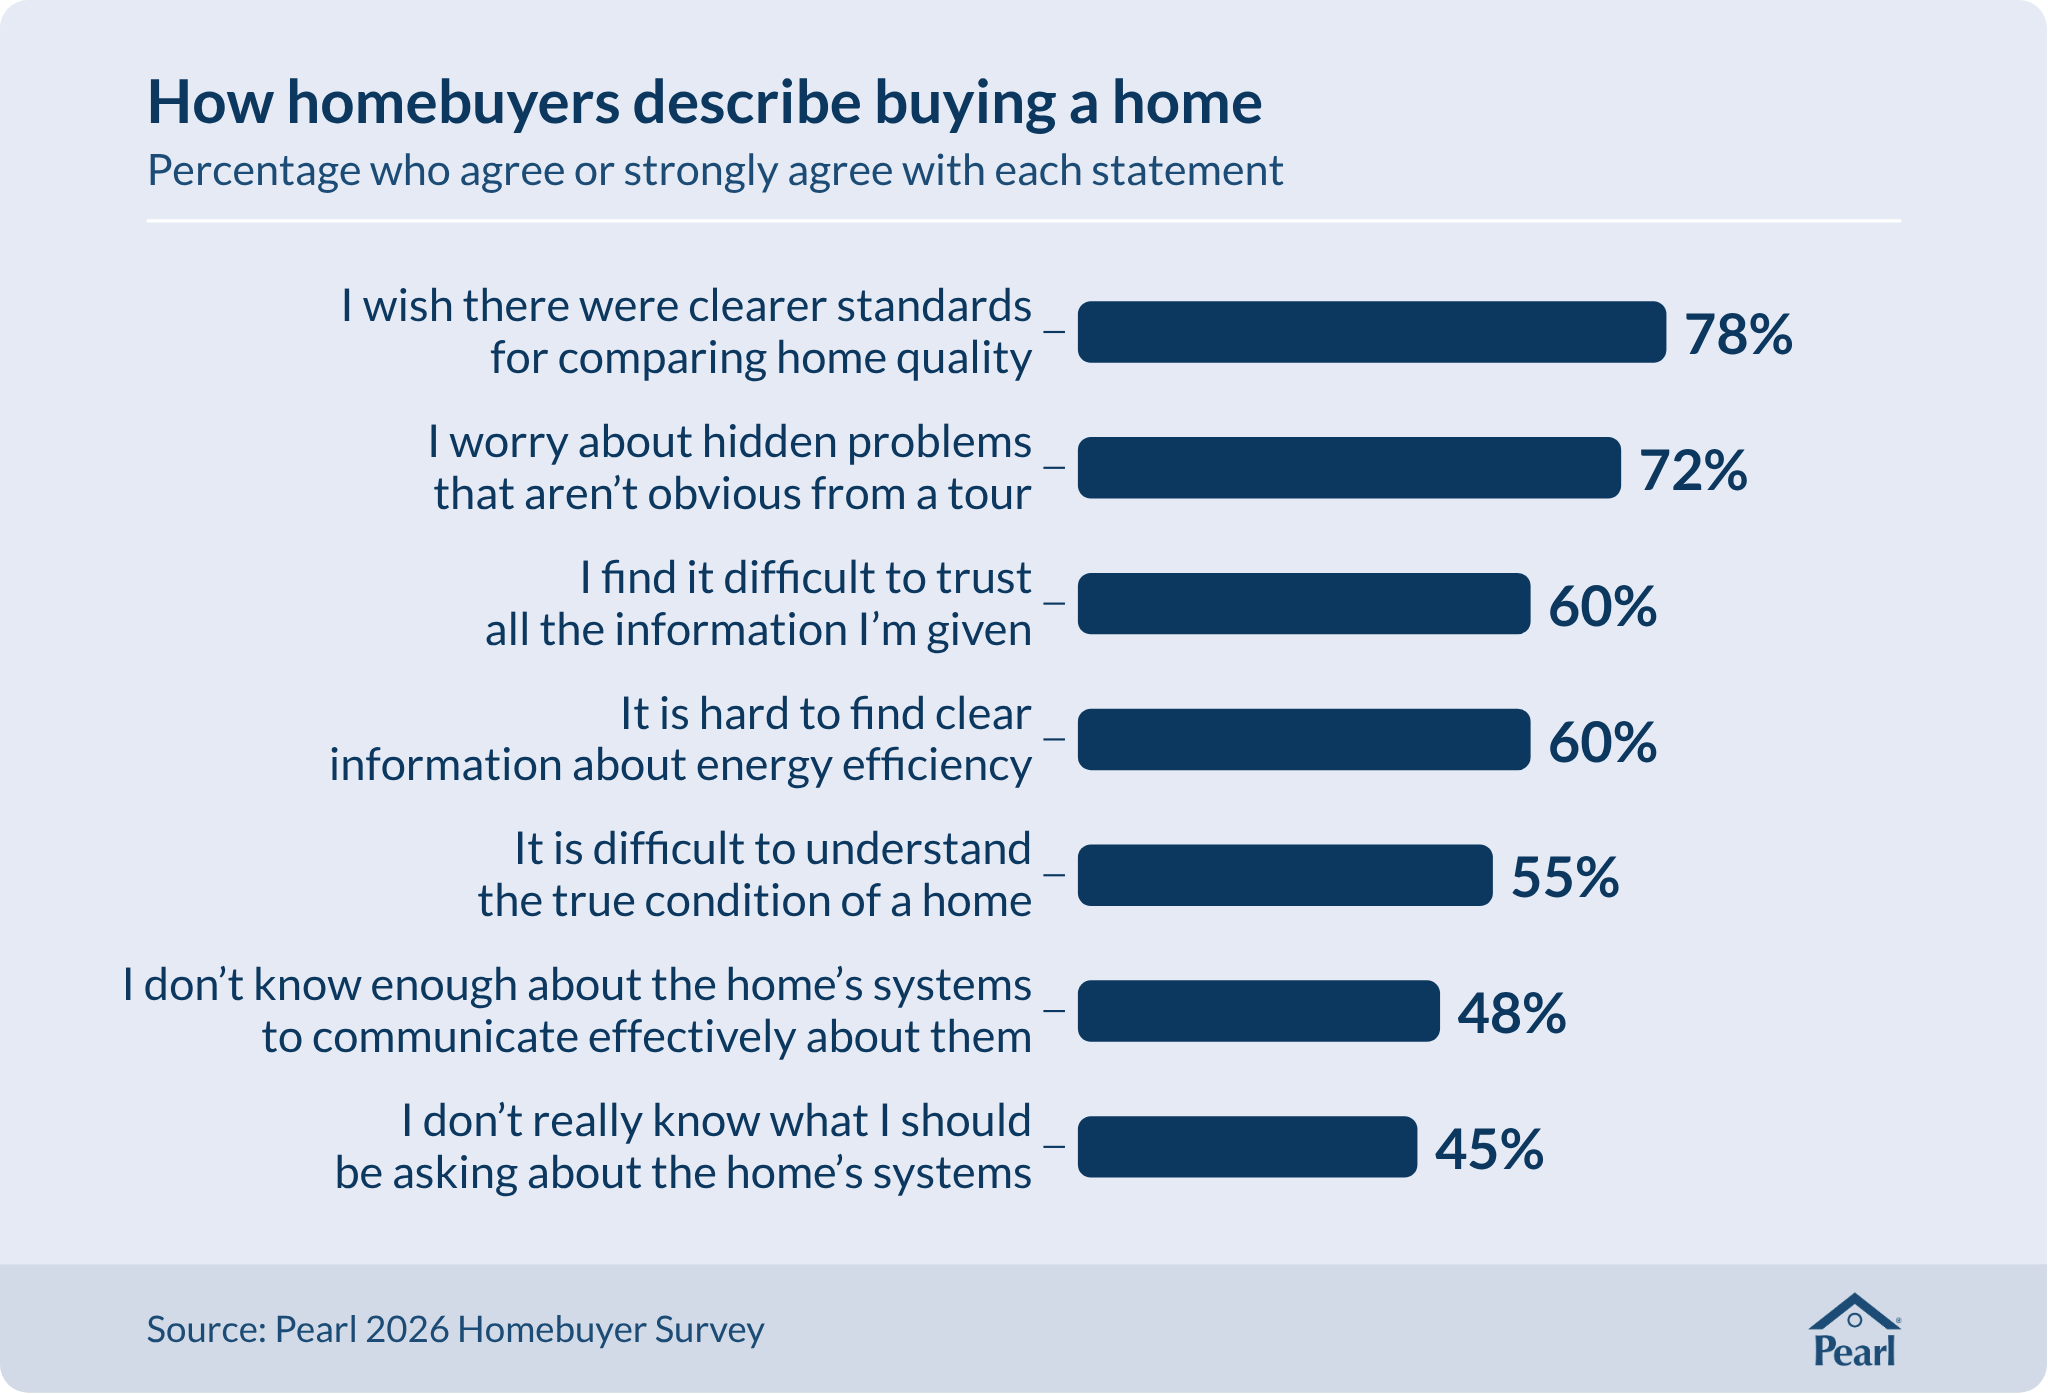
Nearly every buyer we surveyed said they use or would use listing sites to research homes (99%). The same share said they use or would use their agent (Finding 6). Once buyers narrow their choices, a more specific question comes into focus. What would it be like to live in this particular home? As one Atlanta participant put it, buyers may spend “an hour, two max” inside a home before deciding whether to make an offer. More than half of the buyers we surveyed (55%) said it’s difficult to understand a home’s true condition, and 45% said they don’t really know what to ask about its systems (Finding 3).

Part of the difficulty, I think, is that our industry uses the term home performance as if buyers share a common understanding of it. Given the industry’s long emphasis on energy, I wasn’t surprised that the most common answer buyers gave when we asked what the term meant was energy efficiency or utility costs. What struck me was that even this answer came from only 29% of buyers. No other definition drew more than about half that share, and one in six gave answers too varied to group. Nearly half (48%) said they don’t know enough about a home’s systems to communicate effectively about them (Finding 3).

Organizations such as the Building Performance Institute and ENERGY STAR take a broader view of home performance that includes safety and health, comfort, and durability.1,2 Pearl takes that broader view as well. Our definition covers five dimensions of a home’s performance: safety and health, comfort, operations, resilience, and energy management.

Buyers were much clearer about the value of the information itself. Eight in ten (80%) said clear information across all five dimensions would be “very valuable” or “extremely valuable,” and 78% said they wish there were clearer standards for comparing homes across those dimensions (Finding 4). In our view, today’s listings give buyers little basis for making those comparisons.

We call the distance between what buyers want to know about a home’s performance and what listings provide the home performance gap.

I look forward to discussing it with you the next time we meet.

Sincerely,


Cynthia Adams
Co-Founder and Chief Executive Officer

Pearl

  1. Building Performance Institute, ANSI/BPI-1100-T-2023 Home Energy Auditing Standard (Saratoga Springs, NY: Building Performance Institute, 2023), sec. 1, https://bpi.org/__cms/docs/ANSI-BPI-1100-T-2023_Home_Energy_Auditing_Standard_2023-06-06.pdf.
  2. U.S. Environmental Protection Agency and U.S. Department of Energy, Introduction to Home Performance with ENERGY STAR, n.d., https://www.energystar.gov/ia/home_improvement/downloads/Introduction_to_Home_Performance_with_ENERGY_STAR.pdf.
Abstract

Real estate listings report a home’s location, size, layout, age, and price in standard terms that buyers can compare, but they rarely provide standardized information on how the home performs.

This report addresses three questions: which sources of information homebuyers rely on when choosing a home, what performance information they value, and what kind of information they would trust and use. It draws on a February 2026 survey of 833 recent and active homebuyers, as well as focus groups and interviews held in the metro Atlanta area in June and July 2026.

Buyers surveyed rank safety and health first among five dimensions of home performance, with 44% putting it first, more than twice the share for any other dimension. Separately, the condition of a home’s major systems is the home-related need they choose most often (56%), and about half are very or extremely worried about unexpected repair bills or mold and moisture problems (51% each). Many are not confident judging how a home will perform, and 72% worry about hidden problems a tour won’t reveal. Six in ten (60%) say clear information about energy efficiency is hard to find. Buyers’ own definitions of “home performance” vary widely, and energy efficiency is the meaning they give most often. This report defines the distance between what buyers want to know about a home’s performance and the information that listings provide as the “home performance gap.”

Buyers would most trust a performance assessment recommended by a home inspector (80%), and 84% would prefer a buyer’s agent who can provide objective home performance information. Nine in ten (91%) have used or would use general AI tools to research and evaluate homes.

The findings suggest a role for listing agents, buyer’s agents, and listing platforms in bringing reliable performance information into the search for a home before an offer is made.

Introduction

Real estate listings report many of a home’s features in standard terms, such as its location, size, layout, age, and price, so buyers can compare homes on them. They rarely provide standardized information on how a home performs, such as how safe and healthy it is, how comfortable it is, what it costs to run, and how it holds up in storms and outages. How much buyers want that information, and how they weigh it against the features already reported in the listing, bears on decisions across the industry, including what listing platforms display, which multiple listing service (MLS) fields agents complete, what agents discuss with clients, and how appraisers value homes.

Home performance has mostly been studied in terms of energy use, and that research suggests buyers do care about it. The National Association of Home Builders’ “What Home Buyers Really Want” survey asks recent and prospective buyers to rate more than 200 home features on a four-point scale, from “do not want” to “essential.” In the 2024 edition, 83% of buyers rated ENERGY STAR windows essential or desirable, and 80% said the same of ENERGY STAR appliances.1 The American Council for an Energy-Efficient Economy (ACEEE) has tested how buyers respond to energy information in listings. In a 2020 experiment in which 1,538 participants searched simulated home listings, adding energy-efficiency information changed which homes they chose.2

Despite that interest, energy efficiency rarely appears in listings. In an analysis of 2025 listings by the Smart Energy Consumer Collaborative, just over 8% mentioned energy efficiency at all.3 Buyers seldom raise it with their agents either. Only 6% of REALTORS® surveyed by the National Association of REALTORS® (NAR) said clients always or often ask for advice on energy-efficiency upgrades.4

Less is known about how buyers value home performance beyond energy, or how they weigh it against everything else they consider. Energy-efficiency improvements often bring other benefits, such as greater comfort, better indoor air quality, and improved durability,5,6 and some buyers may value those benefits more than energy savings. Studies of pricing and disclosure say little about how buyers value them. They also leave open what buyers want to learn about a home’s performance, how confident they are judging it, whom they trust to tell them, and what form of information they would actually use.

Building-science standards treat comfort, health, and durability as part of home performance itself. The Building Performance Institute’s home energy auditing standard and the federal Home Performance with ENERGY STAR program both include health and safety, comfort, and durability alongside energy use.5,6 Pearl, a ratings and standards organization for home performance, adopts this broader definition and measures home performance across five dimensions: safety and health, comfort, operations, resilience, and energy management.

This study had two purposes. The first was to learn how buyers receive, perceive, and value performance information when buying a home. The second was practical. Pearl was developing tools to help buyers and sellers share information about a home’s performance during the transaction, and needed early evidence as to whether home performance, defined across these five dimensions, matters to buyers at all, or too little to build around. Survey length limited how much we could ask, so questions needed for product development took priority. Most results specific to Pearl’s products informed that work and are not reported here. The exceptions are buyers’ reactions to a described home performance assessment and related information (Findings 4 and 5), which we include because they bear on whether standardized performance information would help buyers. We are publishing the remaining findings because we believe they are relevant beyond our own product decisions to the agents, brokers, and listing platforms who help people buy homes.

The study addressed three questions: which sources of information homebuyers rely on when choosing a home, what performance information they value, and what kind of information they would trust and use. We collected data in two stages. A survey of 833 recent and active homebuyers aged 18 to 60, fielded in February 2026, was followed by focus groups and interviews with recent buyers in the metro Atlanta area in June and July 2026. Both stages addressed all three questions.

We use the term home performance gap to define the distance between what buyers want to know about a home’s performance and what listings provide.

About these findings

Percentages come from a February 2026 survey of 833 recent and active homebuyers. Responses were weighted to match NAR’s figures for buyers’ age, region, gender, and household income. First-time and repeat buyers were then given equal weight so the two groups could be compared, although repeat buyers account for about four in five purchases.7 Where the two groups answered differently, a figure for all U.S. buyers would lean closer to the repeat-buyer answer than the figures in this report. Quotations come from focus groups and interviews in metro Atlanta. They illustrate the survey results and do not measure how common a view is. Full details are in the Methodology section.

Pearl defines home performance across five dimensions. When ranking them, all 833 survey respondents saw these descriptions:

  • Safety and health (e.g., ability to mitigate risks from poor air quality, mold, radon, carbon monoxide, and mechanical safety of systems)
  • Comfort (e.g., ability to regulate temperature, humidity, as well as intrusive noise and light)
  • Operations (e.g., the efficiency of the home’s systems and the resulting monthly operating costs)
  • Resilience (e.g., ability to withstand storms or maintain function during outages)
  • Energy management (e.g., ability to incorporate smart thermostats and electrical panels, EV charging, solar, and batteries)

Finding 1

Buyers rate nearly all home attributes as important but prioritize safety and health when evaluating homes for purchase

1.1 What buyers want from a home

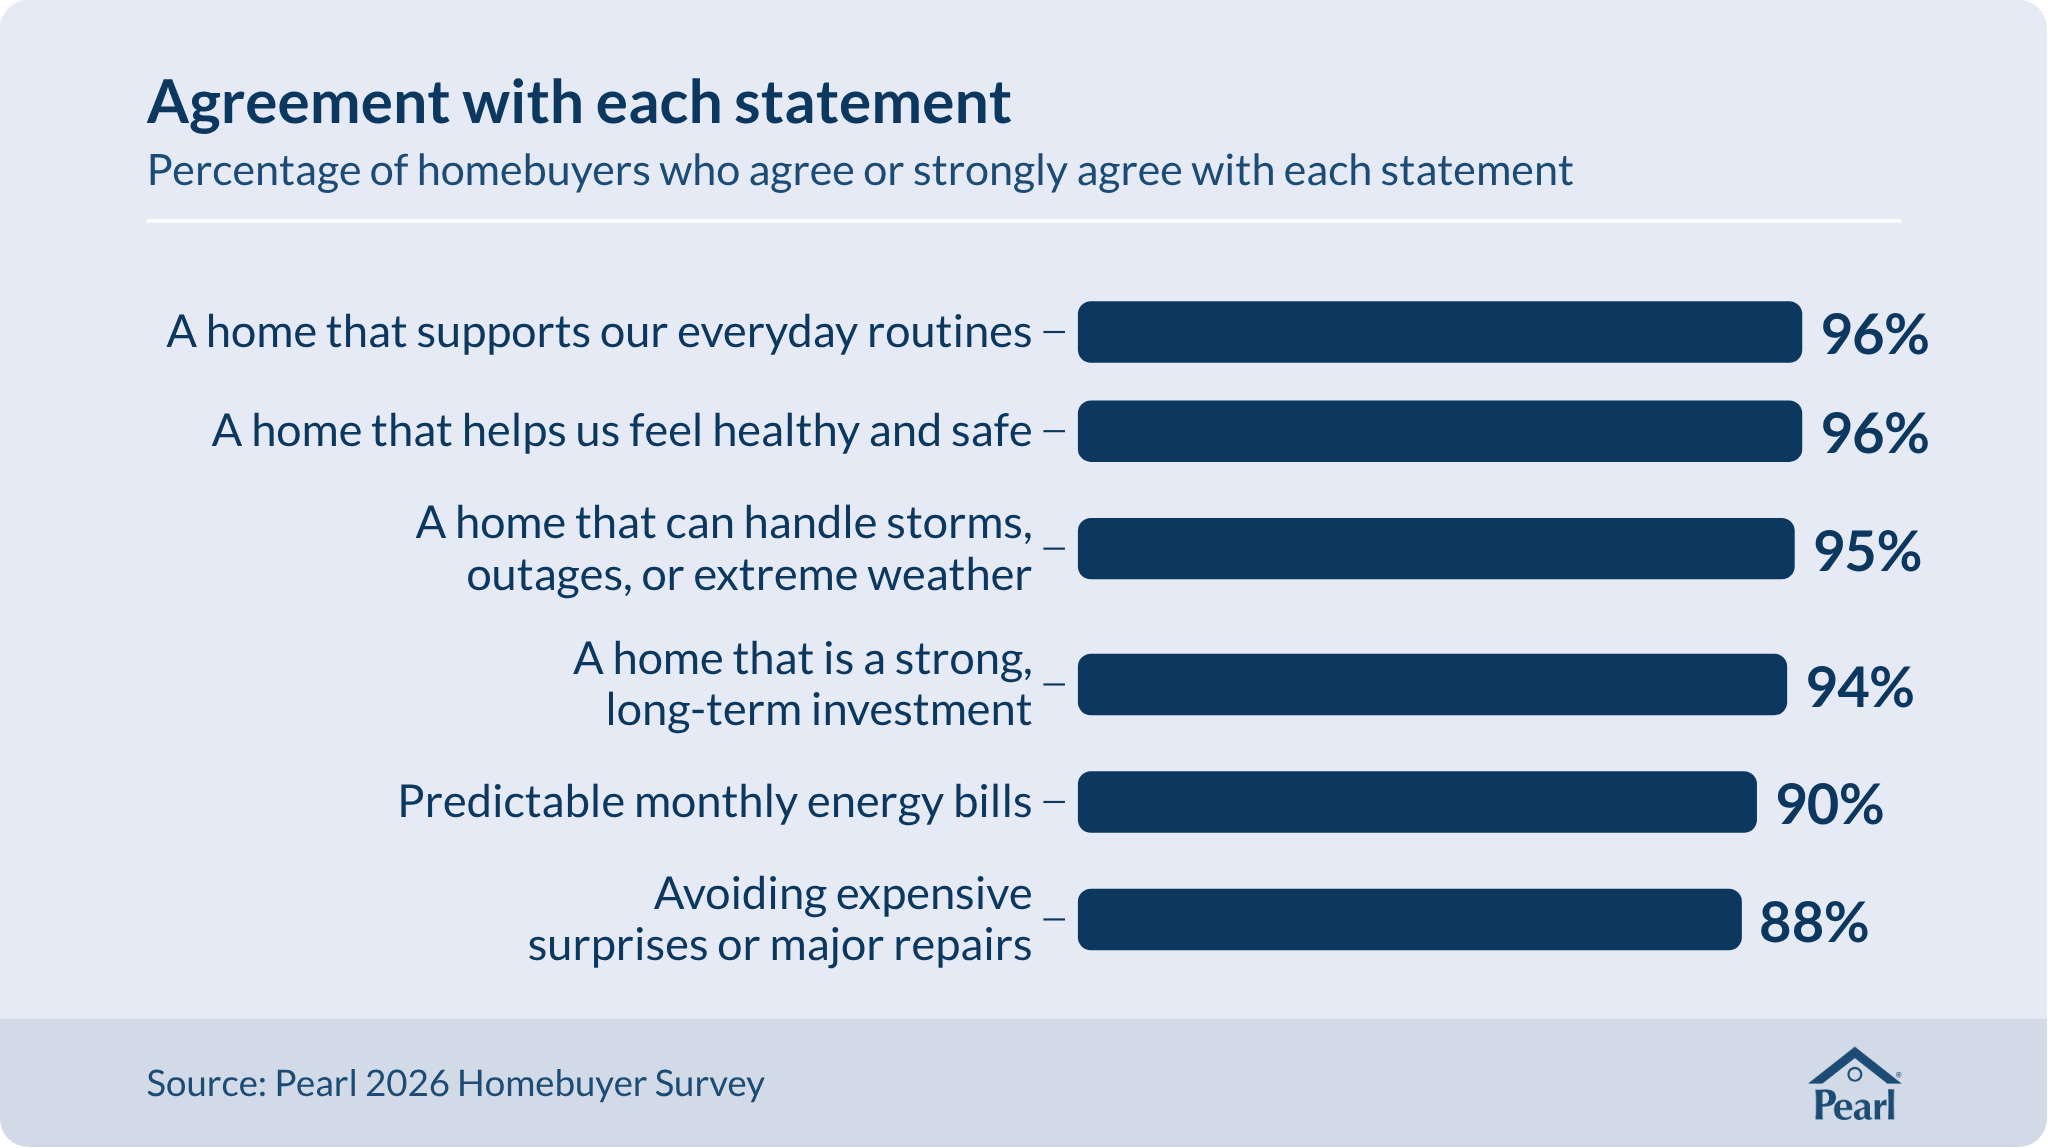
Asked whether they agreed with a set of statements about what they want from a home, buyers agreed with almost all of them. Between 88% and 96% agreed with each one, including wanting a home that helps them feel healthy and safe (96%), one that can handle storms, outages, or extreme weather (95%), predictable monthly energy bills (90%), and avoiding expensive surprises or major repairs (88%).

1.2 What buyers put first when choosing a home

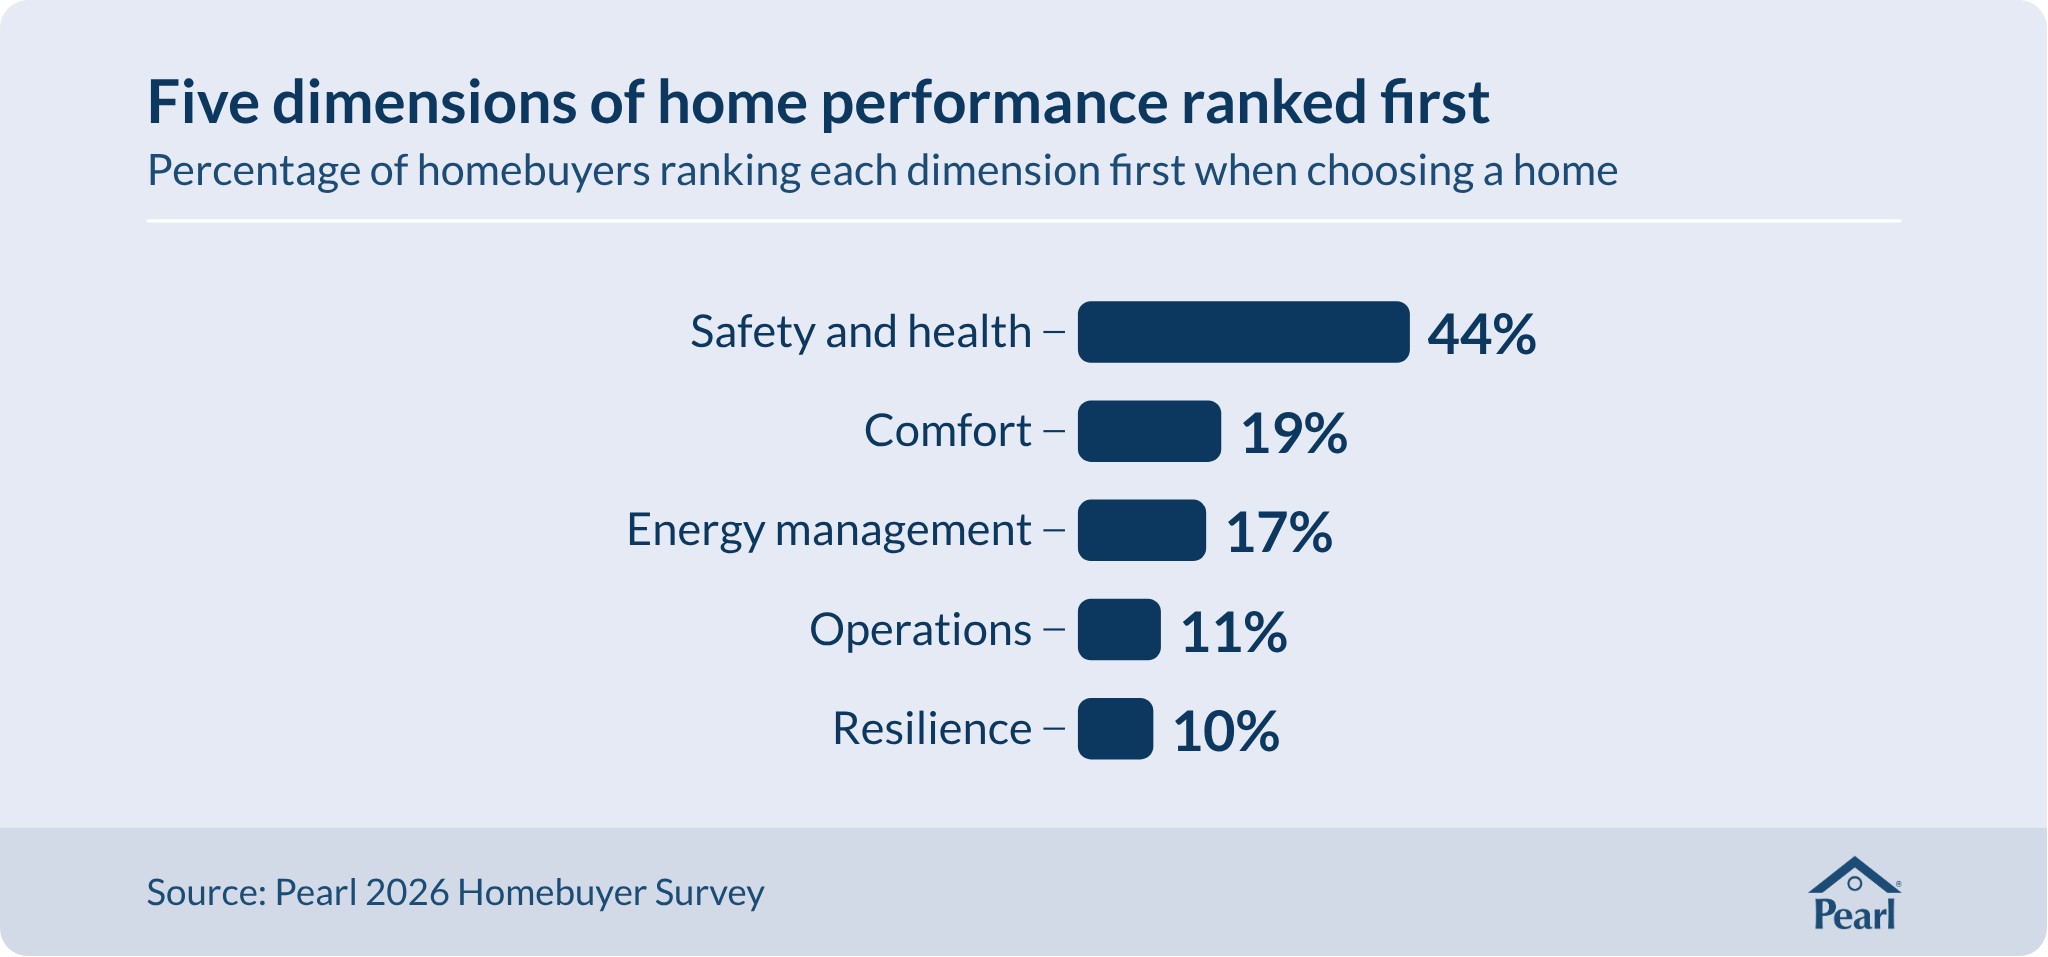
Asked to rank five dimensions of home performance by what matters most when choosing a home, buyers set a clear order. “Safety and health” was ranked first by 44% of buyers surveyed, more than twice the share for any other dimension, followed by comfort (19%) and energy management (17%). When asked which four of 12 factors matter most when deciding whether a home is right for them, including location, price, and size alongside the five dimensions, buyers chose safety and health (55%) more often than location (45%) or price (44%).

Buyers’ general wishes did not carry through when they had to choose. Nine in ten (90%) agreed that they want predictable monthly energy bills, yet operations, the dimension covering a home’s monthly operating costs, ranked fourth of the five dimensions with only 11% of buyers ranking it first. The description of operations shown to respondents did not mention energy bills by name, but the pattern held in questions that named costs directly. Predictable monthly housing costs was among the needs buyers chose least often (33% included it in their top seven of 15), and when asked which four of 12 factors matter most, 28% chose monthly operating costs, fewer than those who chose the size of the home (37%) or the number of bedrooms (32%). Resilience followed the same pattern: 95% agreed they want a home that can handle storms and outages, yet it ranked last of the five dimensions, and first for only 10%.

Ownership costs carried more weight in the final choice between homes. Asked how often monthly ownership costs end up being the deciding factor when choosing between similar homes, 59% of buyers surveyed said often or almost always.

Asked to choose the seven most important of 15 needs when buying a home, buyers chose major systems in good condition (roof, heating and cooling, electrical, plumbing) more often than any other need related to the home itself (56%). Two location needs were chosen more often: a neighborhood that feels safe at different times of day (61%) and a location that fits the household’s lifestyle (57%). Being in an area with low risk of flooding or other hazards was among the needs chosen least often (33%).

1.3 What matters when comparing homes

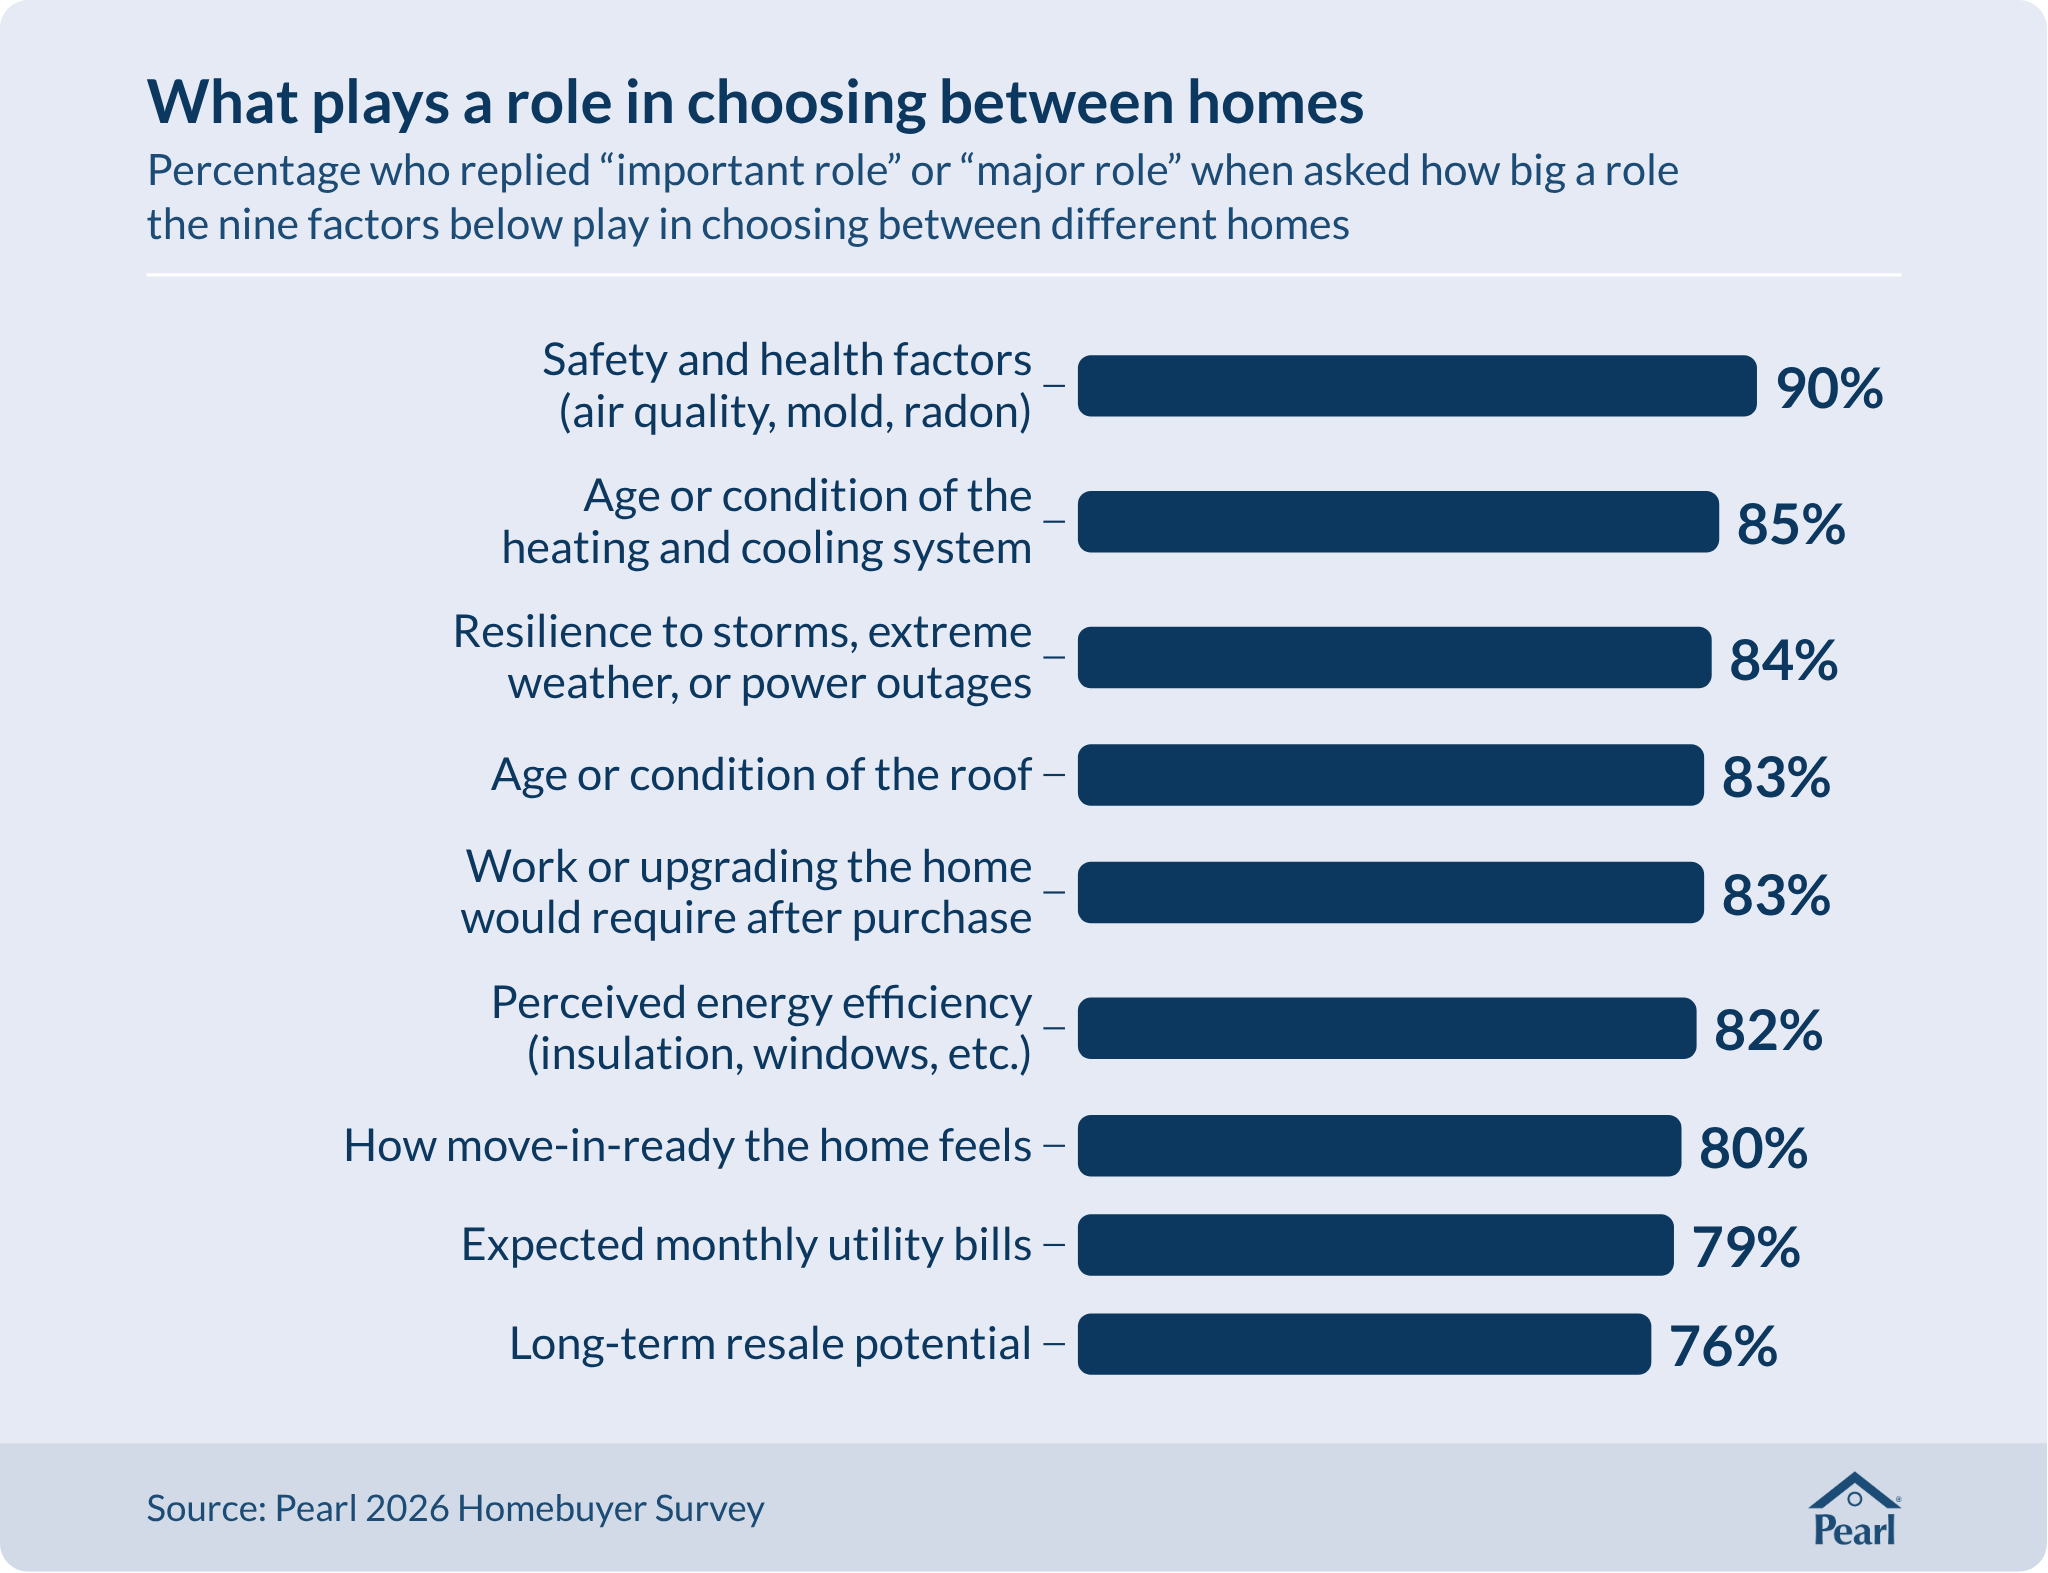
Asked how much of a role each of nine factors plays when they compare homes, buyers rated all nine highly, with between 76% and 90% saying each plays an “important role” or “major role.” Safety and health factors (such as air quality, mold, and radon) led (90%), followed by the age or condition of the heating and cooling system (85%). Resilience to storms, extreme weather, or power outages came third (84%), well above its place when buyers ranked the five dimensions.

Finding 2

Buyers’ worries are broad, and they want information on major systems first

2.1 Risk assessment

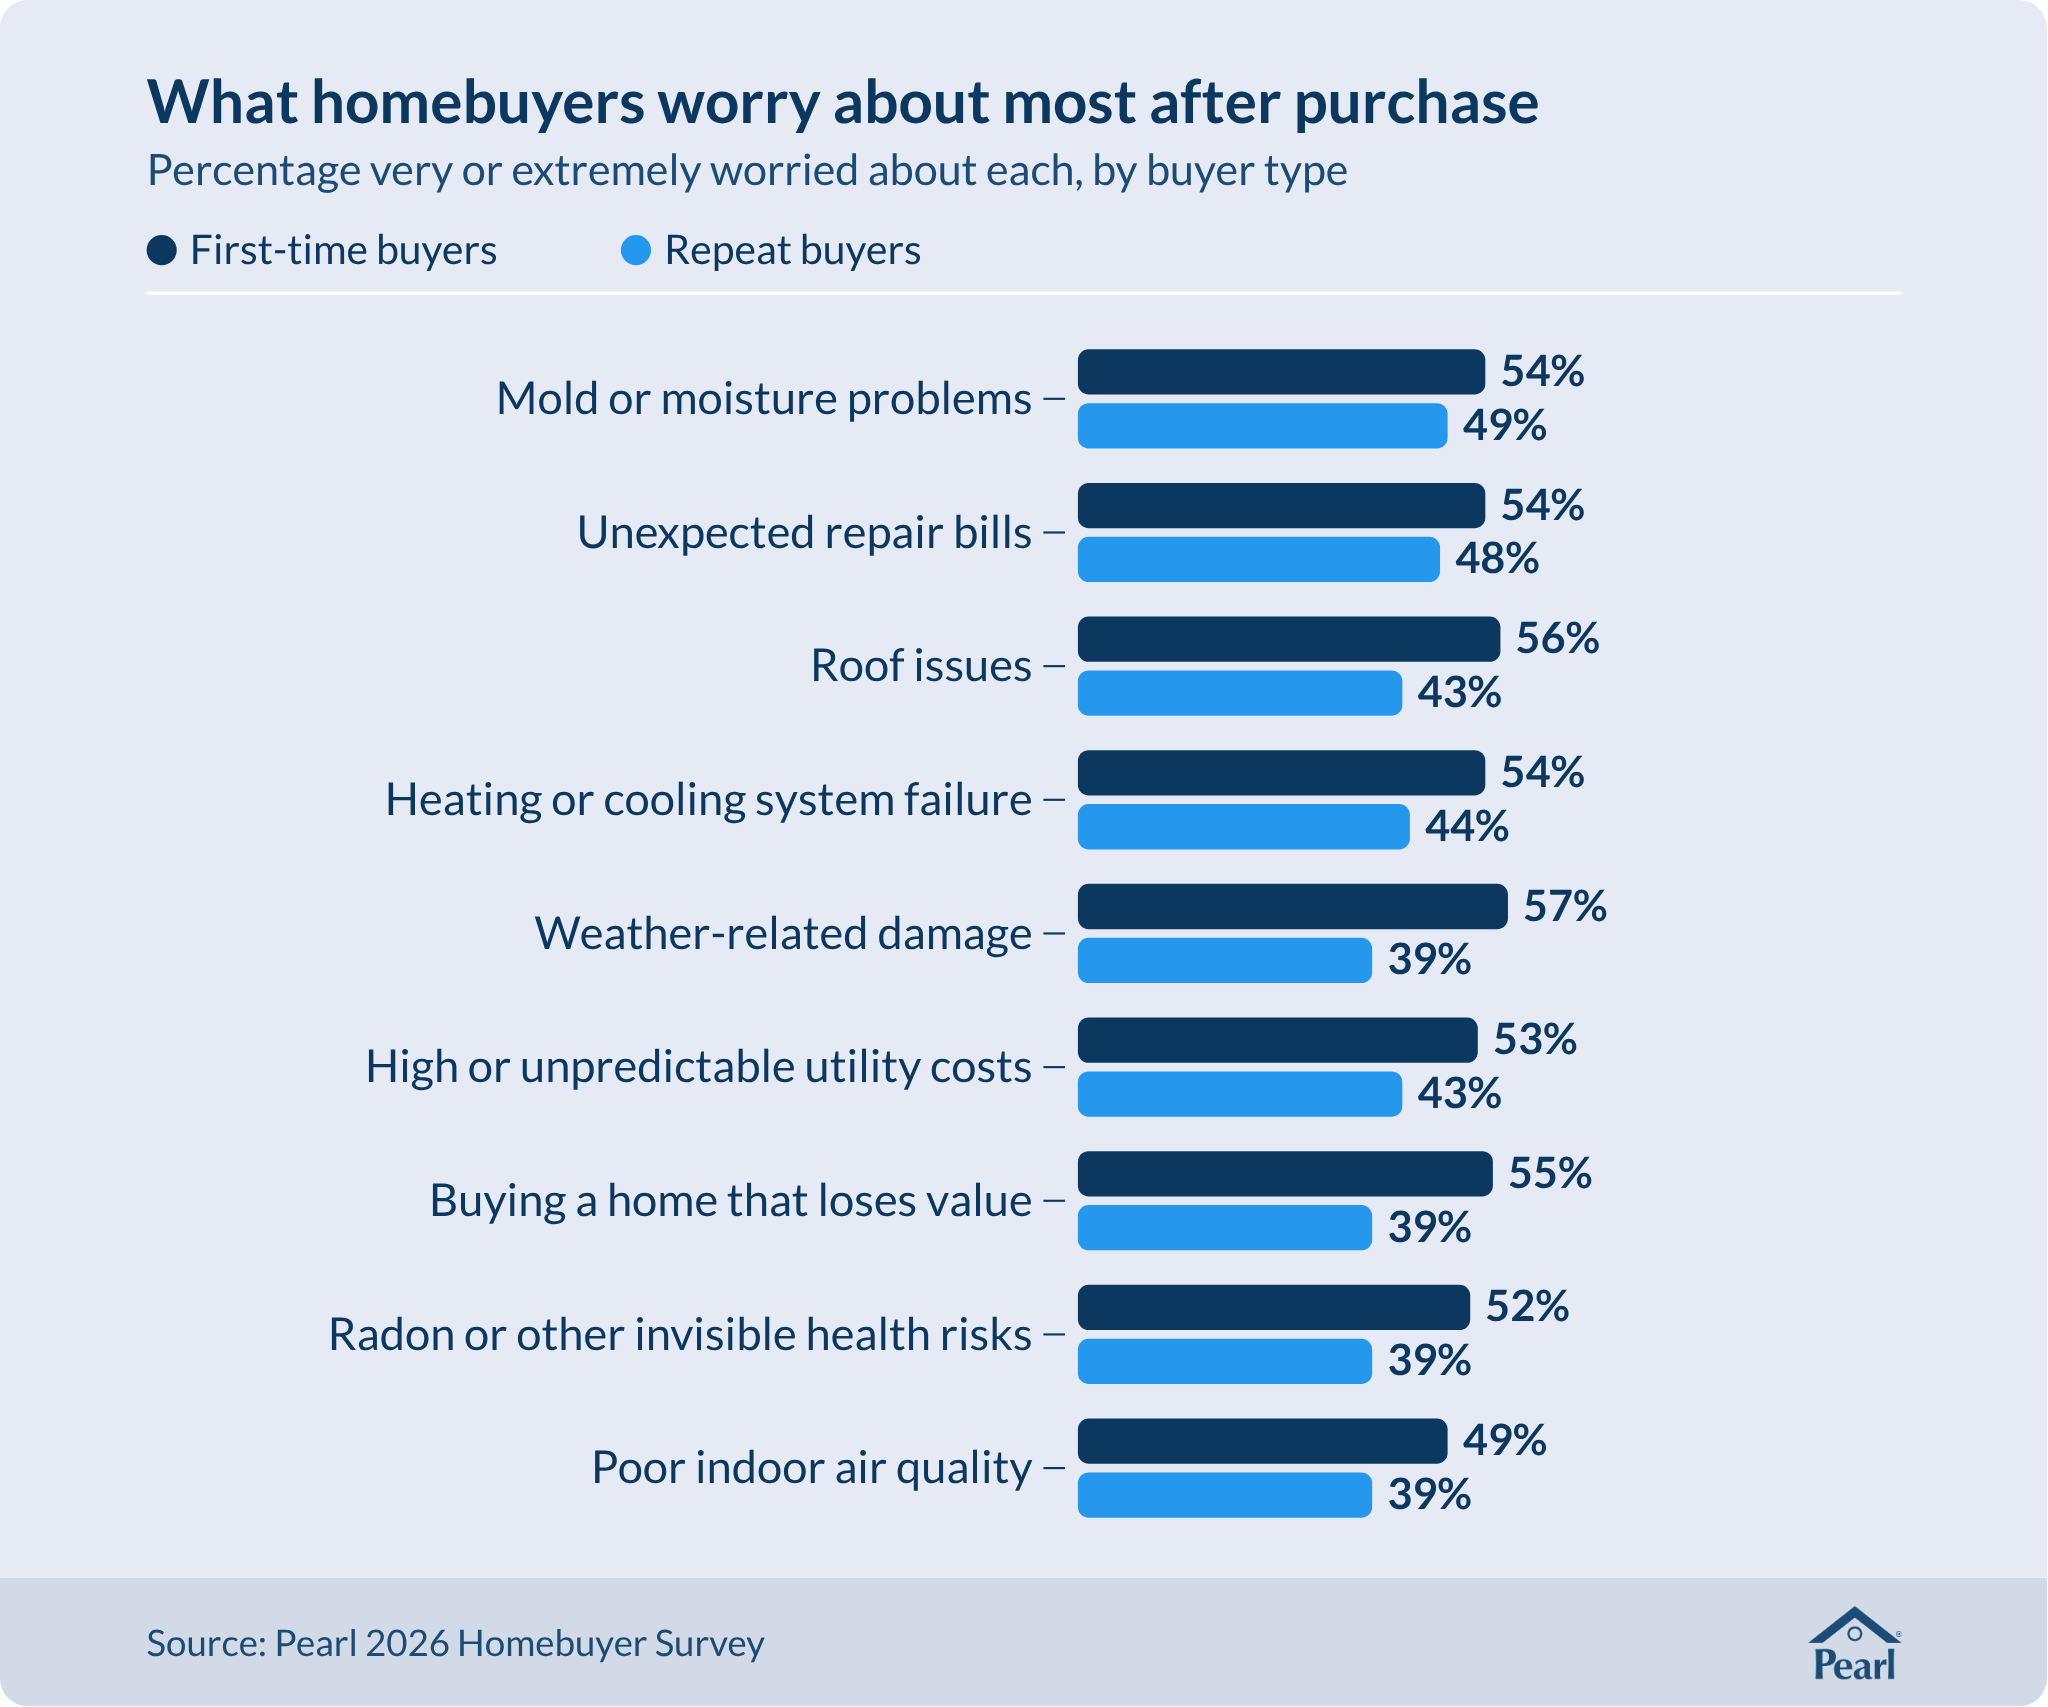
The survey asked buyers how worried they are about nine problems they could face after the purchase. About nine in ten buyers surveyed expressed at least some worry about each one, and between 44% and 51% said they were “very worried” or “extremely worried.” Unexpected repair bills and mold or moisture problems were what most worried buyers, each at 51%.

“I’m doing whatever we have to do so that I don’t end up with a $15,000 bill two months after I move in.”

Atlanta interview participant


First-time buyers were more worried than repeat buyers about seven of the nine problems. The widest gap was 18 points for weather-related damage (57% versus 39%), followed by buying a home that loses value (16 points), and roof issues and radon or other invisible health risks (13 points each). Worry about mold or moisture and unexpected repair bills did not differ significantly between the two groups.

2.2 Risk mitigation

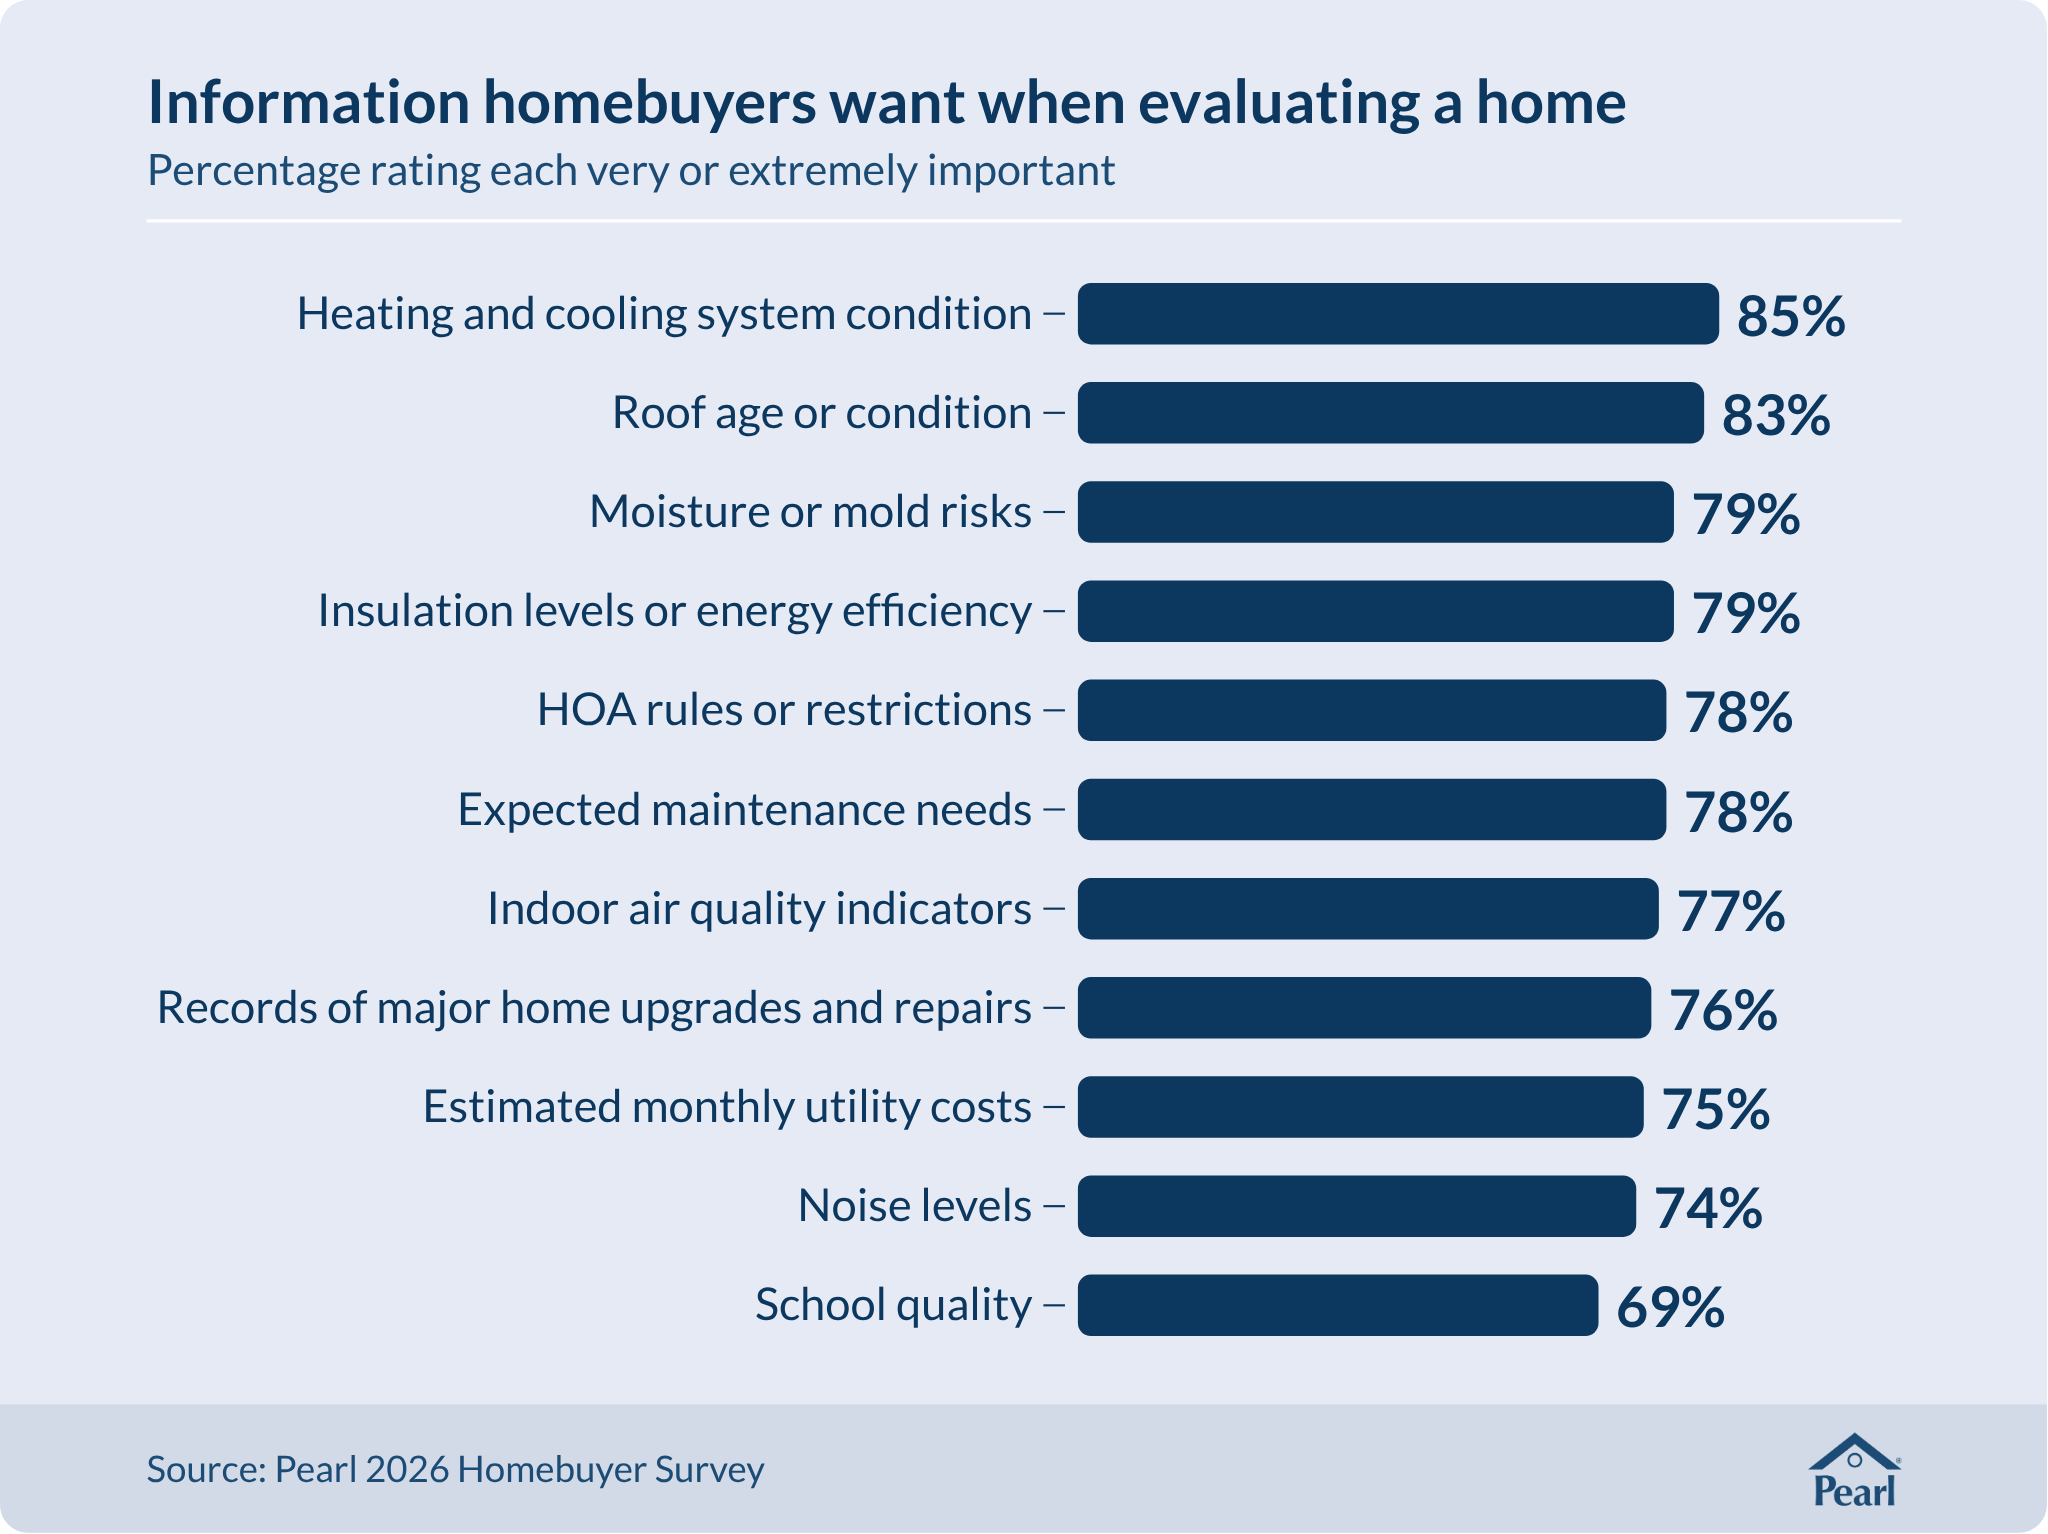
Given these concerns, buyers were asked what information they would like to have when purchasing a home. When evaluating a home, buyers most often rated information on the heating and cooling system as important (85%), followed by the roof (83%), two systems that also appear on the list of worries. Three-quarters (76%) rated records of major upgrades and repairs as very or extremely important information when evaluating a home.

Finding 3

Buyers seek confidence and assurance when choosing a home but are concerned about hidden problems

3.1 Priorities

Repeat buyers placed more weight on confidence and assurance than first-time buyers. Asked how important a set of emotional aspects is when choosing a home, 95% of repeat buyers and 88% of first-time buyers said feeling confident in their decision is very or extremely important. For feeling assured there won’t be major unexpected problems, 90% of repeat buyers and 82% of first-time buyers said the same. Across all buyers surveyed, 91% rated confidence very or extremely important, including 55% who rated it extremely important. Assurance was rated very or extremely important by 86%, and extremely important by 49%.


3.2 Concerns

Seven in ten buyers surveyed (72%) agree that they worry about hidden problems a tour won’t reveal, and repeat buyers are more likely to agree than first-time buyers (78% versus 65%). More than half (55%) found it difficult to understand a home’s true condition. Close to half agree that they don’t really know what to ask about a home’s systems, such as heating and cooling (45%), or that they don’t know enough about those systems to communicate effectively about them (48%).

“A roof just looks like a roof until you know what a bad roof looks like, right?”

Atlanta interview participant

3.3 Confidence

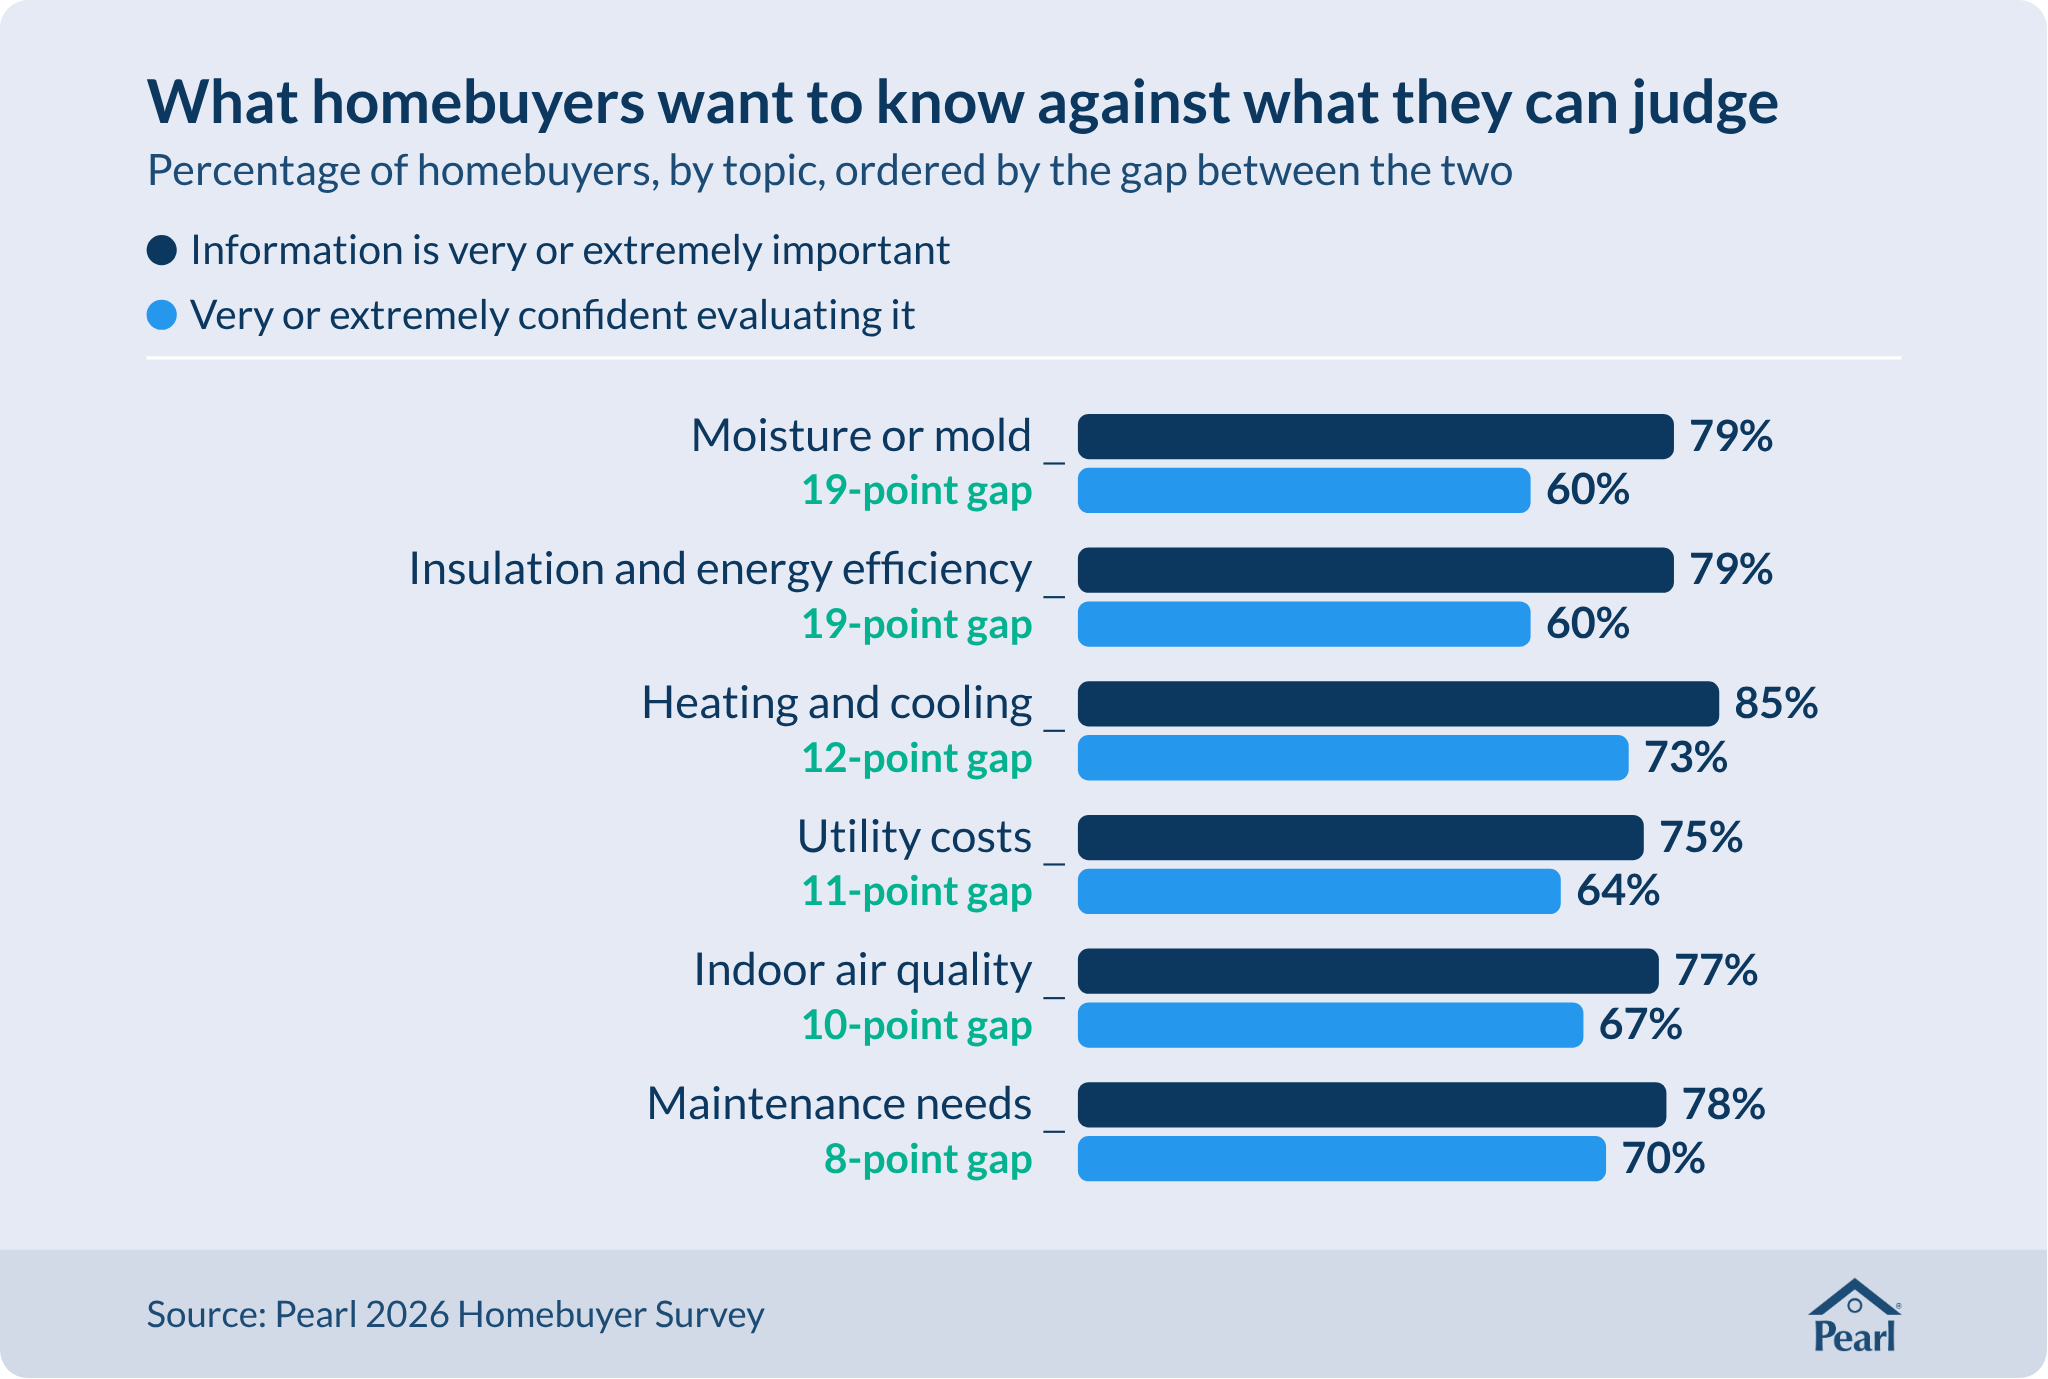
Asked how confident they feel evaluating eight performance aspects of a home, buyers were most confident about the heating and cooling system (73%) and maintenance needs (70%). Confidence was lowest for factors hidden behind walls, under floors, or in the air: 60% for insulation quality and for moisture or mold risks, and 53% for radon-related health risks. Mold and radon are among the safety and health factors that 90% of buyers say play an important or major role when they compare homes. 

“You don’t know what you don’t know.”

Atlanta focus group participant


Repeat buyers were no more confident than first-time buyers in evaluating home performance. They scored lower on all eight factors, though the gap is significant only for air quality and ventilation (61% versus 73%).

Finding 4

Buyers want clear, standardized information for comparing homes

4.1 The term “home performance”

Asked to define “home performance” in their own words, buyers gave a wide range of answers. Energy efficiency or utility costs was the most common meaning (29% of coded definitions), followed by comfort and the indoor environment (15%), and 16% of answers were too varied to group. Safety, health, or air quality appeared in 6% of definitions, although safety and health is the dimension buyers most often rank first when choosing a home (Finding 1).

4.2 Challenges

Buyers report difficulty with the information they have now. Six in ten (60%) agree that it was or is hard to find clear information about energy efficiency.

Buyers also question the information they are given. The same share (60%) agree that they found it difficult “to trust all the information” they were given during the buying process (see Finding 5 for the sources buyers trust most).

4.3 Standardization

Nearly eight in ten buyers surveyed (78%) agree that they wish there were “clearer standards for comparing home quality.” Only 7% disagree.

Asked how valuable it would be to compare homes more easily across safety and health, comfort, operating costs, resilience, and energy management, not just by price, size, and location, 81% said “very valuable” or “extremely valuable.” Nearly as many (80%) said it would be very or extremely valuable to have clear information explaining how a home functions across those areas. Asked whether they would pay for this kind of information, participants in two of the Atlanta groups said yes, and they would pay more for it if it were standardized and objective or if it let them compare one home with another.

“Do we like the location? Do we like the aesthetics of the house, both inside and outside? That’s really what we’re limited to, up until the point where we get that homeowner’s inspection.”

Atlanta interview participant

4.4 Reactions to a described assessment

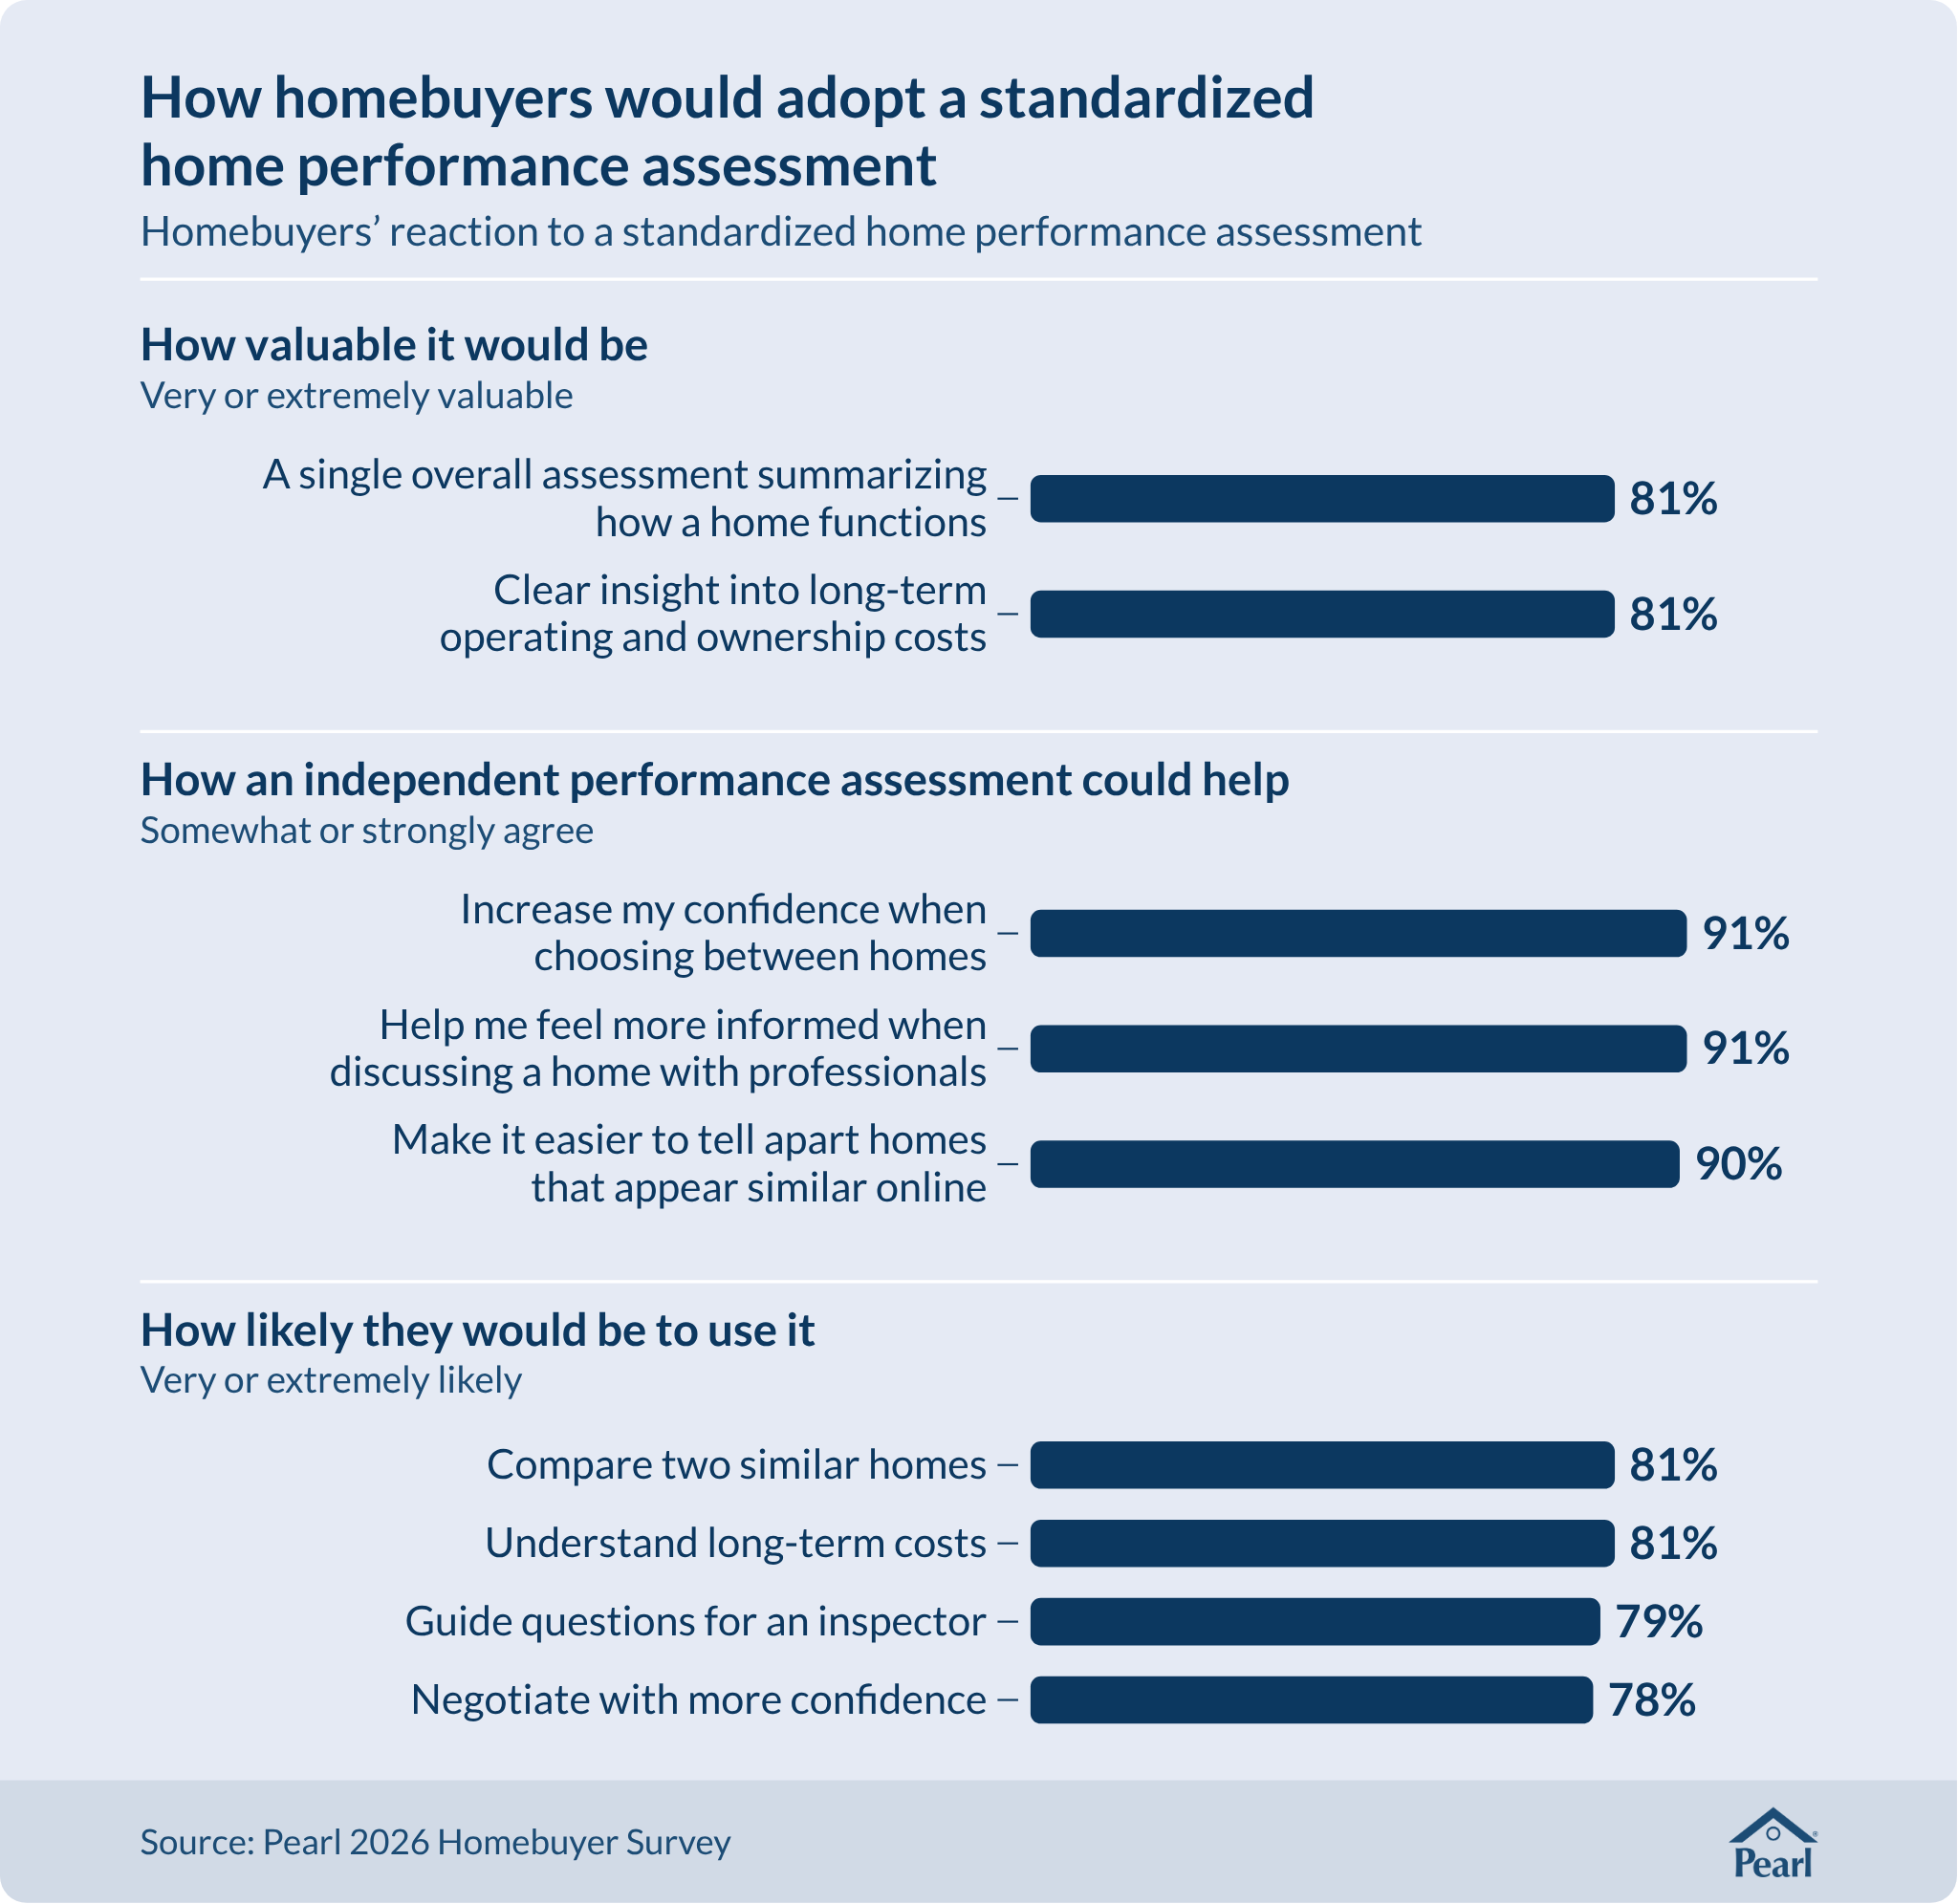
The survey asked about an independent, overall assessment of how a home performs across the five dimensions of home performance. Asked how valuable it would be to have a single overall assessment summarizing how a home functions across those dimensions, 81% of buyers surveyed said very or extremely valuable. The same share (81%) valued clear insight into long-term operating and ownership costs, such as typical utility bills and maintenance.

Most buyers agree such an assessment could help them choose. Nine in ten said it could increase their confidence when choosing between homes (91%), make it easier to tell apart homes that appear similar online (90%), and help them feel more informed when discussing a home with agents and inspectors (91%).

Asked how likely they would be to use this kind of information, 81% said very or extremely likely to compare two similar homes and to understand long-term costs, 79% said they would use it to guide questions for an inspector, and 78% to negotiate with more confidence. These questions measured buyers’ reactions to a described score, not how they use one in practice.

Finding 5

Buyers would prefer an agent who can provide objective performance information

5.1 Information from agents

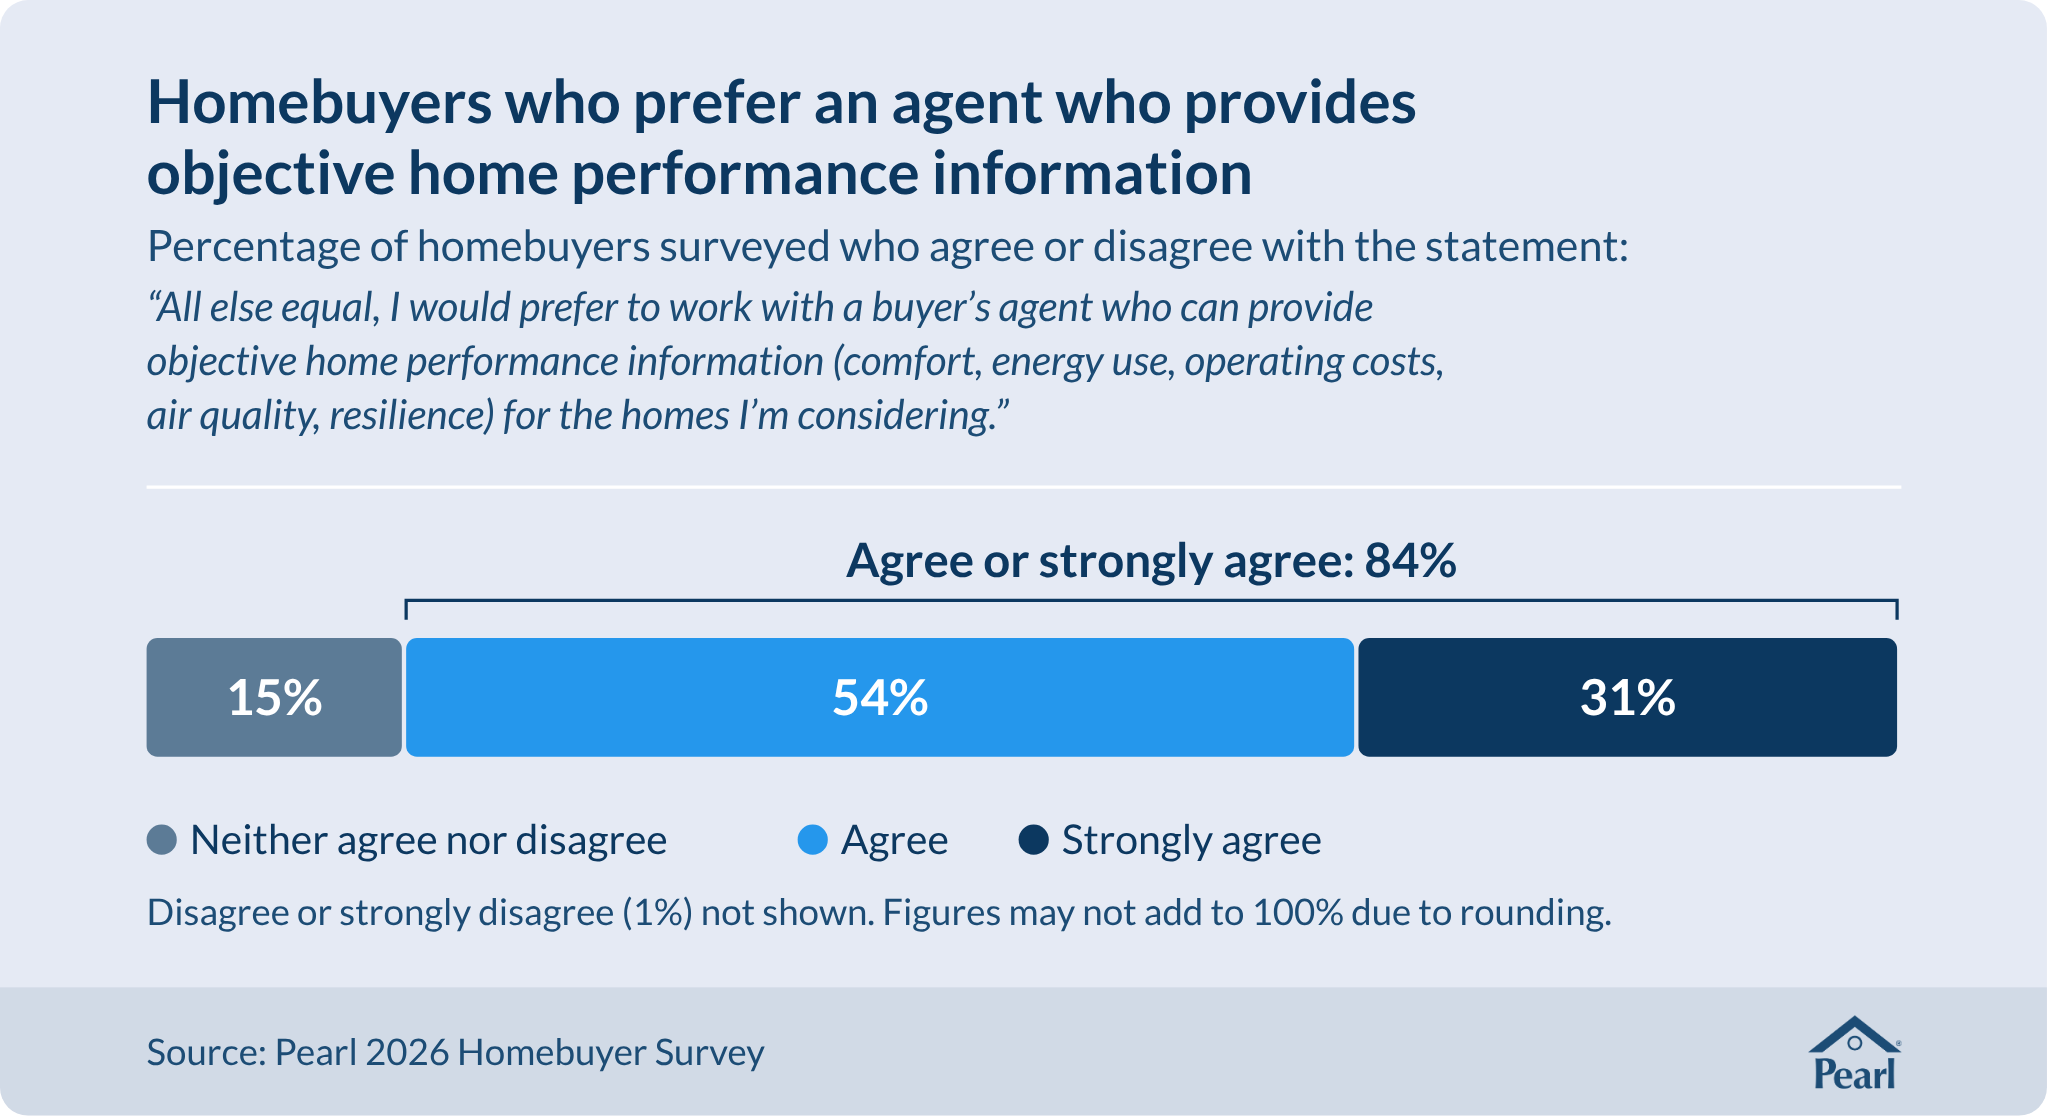
Asked whether, all else equal, they would prefer to work with an agent who can provide objective home performance information on the homes they are considering, 84% of buyers surveyed agreed, including 31% who strongly agreed. One percent disagreed.

5.2 Trusted information

Buyers placed less trust in a performance assessment recommended by an agent than in one from a home inspector or contractor. Asked how likely they would be to trust a home performance assessment depending on who recommended it, 80% said “very likely” or “extremely likely” if it came from an inspector and 77% from a contractor. For a real estate agent, the figure was 64%, and for friends or family, 61%.

Asked what would make them trust such an assessment, buyers rated authorship, recommendation, and homeowner involvement highest.

  • Most often, they said it was very or extremely important that the people who created the assessment are clearly identified, with relevant credentials and experience (84%).
  • Next came a recommendation from an inspector or building professional they trust (82%).
  • Third was involvement by the homeowner in providing transparent information (78%).

“It has to be third party, somebody [who] doesn’t have any interest [in] getting this home [sold].”

Atlanta focus group participant

Repeat buyers were less likely than first-time buyers to trust a performance assessment recommended by an agent (59% versus 70%) or by friends or family (54% versus 69%). They were more likely to prefer a buyer’s agent who can provide objective performance information (89% versus 80%), and to say they like to see data or evidence before trusting claims about a home (86% versus 78%). Each of these differences is statistically significant.

Finding 6

Most buyers use or would use general AI tools in their home-buying process

6.1 Information preference

Asked how well a set of statements described them, 81% of buyers surveyed said they like to research thoroughly before making decisions, and 82% said they like to see data or evidence before trusting claims about a home.

6.2 Information sources

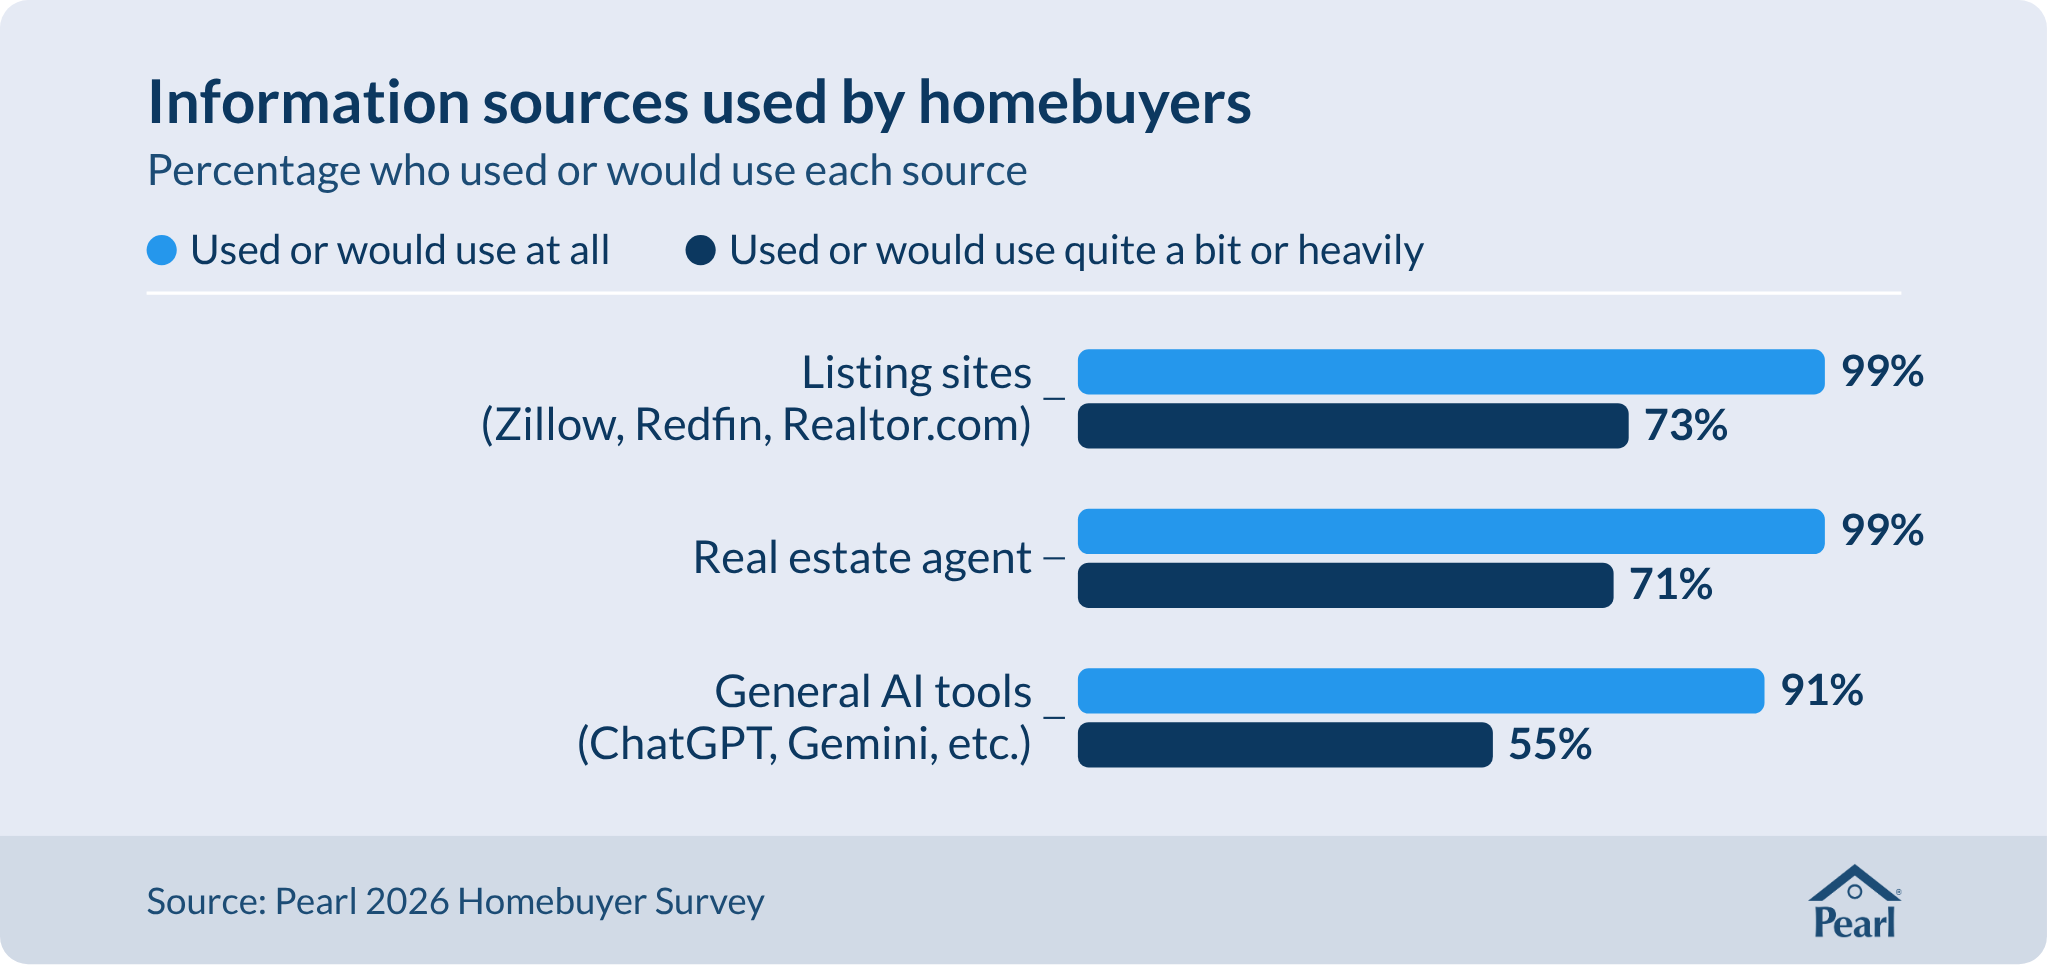
Asked which sources they used or would use in the buying process, 99% of buyers surveyed named listing sites such as Zillow, Redfin, and Realtor.com, and 99% named their real estate agent. General AI tools such as ChatGPT were named by 91%, and 55% said they would use them quite a bit or heavily.

“I personally would not have paid for [home performance information]. I could have gotten anything additional that I didn’t get from a realtor, from ChatGPT, or walking through the house, taking pictures. AI platform that can do a lot of this, and possibly better.”

Atlanta focus group participant

Discussion

The six findings identify a gap between what buyers want to know about a home’s performance and what real estate listings provide today. Buyers rank safety and health first among the five dimensions of home performance, and the condition of a home’s major systems is the home-related need they choose most often (Findings 1 and 2). Many do not feel equipped to judge those systems on their own, lack a common term for home performance, and want clear, standardized information for comparing homes (Findings 3 and 4). They trust inspectors and contractors more than agents, and most would prefer an agent who can provide objective information (Finding 5). Most already use or would use general AI tools alongside listing sites and agents (Finding 6).

The results suggest buyers want performance information that comes from someone with firsthand experience with the home (the homeowner or inspector), vetted by a credible third party with no stake in the sale, and recommended by their inspector, contractor, or agent, in that order.


What listings provide homebuyers today

Listing sites shape what nearly all buyers see first about a home, and performance information is largely missing from it. On Zillow, in one interview participant’s words, “you see this house at face value.” The listing system already has fields for some of this information, but little of it reaches buyers. The RESO Data Dictionary, the national standard for listing data, defines fields for heating and cooling systems, construction and roofing, windows, and energy-efficiency and indoor-air-quality features.8 In NAR’s 2025 “Residential Sustainability Report,” 44% of agents said their MLS includes green data fields and 40% were not sure; nearly half of those with access (47%) said they do not use them.4 An analysis of listing text by the Smart Energy Consumer Collaborative, NAR, and 257, a residential energy data platform, found that just over 8% of 2025 listings mentioned energy efficiency at all, and that where a heat pump was present, the listing mentioned it only 8% of the time.3


“There’s no public record where you go and register… I bought an HVAC system last year… There is no system like that for houses outside of property taxes.”

Atlanta interview participant

Agents report getting few questions on the subject. Only 6% of agents said clients “always” or “often” ask for advice on energy-efficiency upgrades.4 The survey did not ask buyers why they raise it so rarely, but its results point to two likely reasons. Buyers lack a common term for home performance: their own definitions vary widely, and 45% agree they don’t really know what to ask about a home’s systems (Findings 3 and 4). Many also do not look to their agent as the source for answers on these questions. They would trust a performance assessment recommended by an agent less than one recommended by an inspector (64% versus 80%, Finding 5).


Buyers are turning to generic AI tools

Most buyers surveyed use or would use generic AI platforms like ChatGPT (Finding 6). Several participants in the Atlanta focus groups said they could not have purchased their home without these tools. The survey did not ask how much buyers trust what these tools tell them, although one participant in the Atlanta focus groups walked away from a deal on the advice of a generic AI platform that had read her inspection report.


“I just didn’t know what I was looking at. I got an 82-page inspection, and I was like, what matters, and my realtor was just trying to sell me on the house… I had Claude. Claude saved me from a lemon of a house. I would be in the wrong house if it weren’t for Anthropic Claude AI… a neutral source that’s not trying to sell you on anything.”

Atlanta focus group participant

The same type of reliance was noted in one agent’s account published by Inman. A buyer canceled a contract after an AI tool estimated repairs at about $250,000; two licensed contractors later priced the same work at about $17,000 and $19,000.9

The findings suggest that general AI tools are filling a role this report describes in Findings 3 to 5: interpreting what buyers cannot judge on their own, from a source outside the transaction. How reliable that interpretation is, how buyers use AI during the process, and how much weight they give AI’s answers are questions for further research.

A precedent from used cars

Because detailed home performance information has not traditionally been part of residential real estate transactions, sellers and their agents may see its introduction as a risk to the sale. The used-car market offers a test of that concern. After federal rules in 1986 required odometer records and states enforced them, mileage disclosure in classified ads rose 23.4%, asking prices rose 9.7%, and cars sold 13.4% faster, measured by fewer repeated ads.10 More reliable information was associated with better outcomes for sellers.

Vehicle history reports later became a common feature of used-car listings through voluntary industry adoption, rather than a federal requirement.11 Industry-sponsored research also found positive associations between the availability of vehicle history reports and online marketplace performance.12 Although these industry-sponsored findings do not establish causation, they suggest that providing independent information may offer commercial benefits beyond the information itself, including greater engagement and higher conversion.


Implications for agents and platforms

In Pearl’s view, the findings point to a role for three groups:

Listing agents

The listing agent is best placed to close the home performance gap, because the seller holds much of what buyers want to know: the age of the systems, the work done, the problems fixed. For buyers to trust a home performance assessment, 78% say it is “very important” or “extremely important” that the homeowner has actively provided transparent information about the home. In the Atlanta focus groups, a report built only from public records and claims data, without the owner’s input, was dismissed by one participant as “suspect.” Another said they would “pay more [for a home] or be more inclined to look at a property if the homeowner voluntarily disclosed this information [and] it was certified by a third party.”

The first step is already available to most listing agents. The national listing standard defines multiple fields for a home’s performance features. Completing these fields wherever the MLS provides them would put basic performance information in front of buyers where most of them start their search (Finding 6). Buyers also want more detail than a listing field can hold. Eight in ten (80%) say clear information explaining how a home functions across the five dimensions would be very or extremely valuable (Finding 4), and 76% rate records of major upgrades and repairs as very or extremely important when evaluating a home (Finding 2). Buyers’ trust also depends on who produces the information: 84% say it is very or extremely important that the people who created an assessment are clearly identified, with relevant credentials and experience (Finding 5).

One interview participant described the used-car precedent from the buyer’s side: dealers provide a CARFAX report “because they want to show you that they are on the up and up.” Further research is needed to test this for housing, but it seems plausible that a listing with verified performance information would earn more trust from buyers and lead to fewer surprises later in the transaction, such as when the inspection report arrives.


Buyer’s agents

As stated in Finding 5, 84% of buyers would prefer an agent who can provide objective performance information on the homes they are considering, and most say they would use such information to compare similar homes (81%) early in the buying process (Finding 4). One interview participant said they wanted their agent to have the report “when they come to meet with me.” The information provided has to be independent and objective. Another participant did not want it to come from the agent at all: “Somehow I don’t want it from the realtor. … I don’t want it from anyone who has a vested interest either way.”

Today, most buyer’s agents rely on the listing to provide them with information about the home, but few listings include performance details. These findings suggest that an agent who brings independent information, without authoring it, can differentiate themselves, deliver more value, and earn buyers’ trust.


Listing platforms

Platforms are where most buyers start: 99% of buyers surveyed “used or would use” listing sites to narrow down homes to evaluate (Finding 6). Buyers also see them as neutral. “Zillow doesn’t have a dog in the game,” one interview participant said. “It just wants to show you the information.”

The national data standard already defines fields for energy-efficiency and other green features,8 yet nearly half of agents with access to green data fields in their MLS say they do not use them.4 In used-car marketplaces, vendor research has linked free history reports to stronger listing performance: an analysis by Experian and TrueCar found that listings offering a free vehicle history report converted to leads at a 27% higher rate and to sales at a 50% higher rate.12 The analysis did not report whether it accounted for differences in the vehicles’ price, age, or condition. It is reasonable to expect that a platform which presented home performance information consistently, so buyers could compare like with like, would meet the demand for standardized, comparable information described in Finding 4.

Future research

This research set out to measure the sources on which buyers rely, the performance information they value, and what they would actually trust and use. The survey and the Atlanta sessions point the same way: buyers care deeply about performance-related factors, but the traditional home-buying process gives them little by which to judge.

The way buyers look for answers is changing quickly. Nine in ten buyers we surveyed used or would use general AI tools to research homes, and participants in our Atlanta sessions were already using those tools to interpret inspection reports. Other research points to a widening gap between use and trust: in a Cotality study published in April 2026, three in four buyers across four countries assumed AI is already part of home buying, while trust among U.S. buyers in AI to help find a home fell from 30% to 16% in a year.13

This research raises new questions to explore. They include how buyers use AI platforms in the home-buying process today; what they ask their AI tools at each stage of the search; how far they trust the answers compared with those of inspectors, agents, and sellers; and at what point in a transaction they act on AI-generated advice. They also include how buyers respond when reliable home performance information is in front of them before making an offer.

Conclusion

Buyers want to know how a home will perform, both as a place to live and as an asset. The factors they rank most important, safety and health and the condition of a home’s systems, are among those they feel least able to judge on their own, and they lack a common term for asking about them. Today, little of the information they seek appears in the listings where buyers start their search.

In Pearl’s view, closing the home performance gap would let buyers judge how a home will perform before they commit to purchasing it, while providing the industry with a standard way of describing what buyers most want to know.

Methodology

This research was commissioned and funded by Pearl. The survey, focus groups, and interviews were designed and conducted on Pearl’s behalf by independent research specialists.

The report draws on four studies: a usability study in spring 2025, a quantitative survey in February 2026, three focus groups in June 2026, and ten individual interviews in July 2026.


Usability study (2025)

A moderated usability study with 14 single-family homeowners in seven states, conducted on an early prototype of a home performance score. It informed the survey design.

Survey (2026)

  • Sample: 833 U.S. adults aged 18 to 60 in the 48 contiguous states who had purchased a single-family detached home as their primary residence in the previous 12 months or were actively shopping for one: 417 first-time buyers and 416 repeat buyers. Participants did not know Pearl was behind the survey.
  • Recruitment: A non-probability sample drawn from Symmetric’s triple-opt-in, identity-verified consumer panels. Respondents received cash compensation.
  • Fielding: Online and mobile-friendly, median length 17 minutes, February 5 to 27, 2026, following a soft launch.
  • Quality control: Automated fraud detection, including digital fingerprinting, proxy and bot checks, and geo-verification, with trap questions and review of open-ended responses.
  • Weighting: Weighted to National Association of REALTORS® benchmarks for age, region, gender, and household income. Income was weighted in three bands: under $100,000, $100,000 to $149,999, and $150,000 or more. First-time and repeat buyers were weighted equally so the two groups could be compared, and figures for all buyers combined them in roughly equal proportion. Because repeat buyers make up most of the market7, a national figure would lean toward their answers. Unless otherwise noted, all percentages are weighted.
  • Precision: Because the sample is non-probability, a conventional margin of sampling error is not reported. Differences between first-time and repeat buyers are reported only where the survey data tables mark them as statistically significant at the higher of the two confidence levels shown.
  • Measures: Most questions used five-point scales. Unless otherwise noted, percentages combine the top two points of the scale, for example “very” and “extremely.” Open-ended definitions of “home performance” (Q6a) were coded by the survey’s research specialist; percentages are shares of 377 coded responses and are not weighted.

Performance dimensions

Pearl defines home performance across five dimensions. Respondents saw the descriptions below with the question asking them to rank the dimensions (Q15), in the fifth of the survey’s eight sections. Questions about buyers’ general priorities, worries, and information sources came in the first four sections, before respondents were shown Pearl’s five dimensions, so that those answers would not be shaped by Pearl’s framework.

When answering the ranking question for the five dimensions (Q15), all 833 survey respondents saw these descriptions:

  • Safety and health (e.g., ability to mitigate risks from poor air quality, mold, radon, carbon monoxide, and mechanical safety of systems)
  • Comfort (e.g., ability to regulate temperature, humidity, as well as intrusive noise and light)
  • Operations (e.g., the efficiency of the home’s systems and the resulting monthly operating costs)
  • Resilience (e.g., ability to withstand storms or maintain function during outages)
  • Energy management (e.g., ability to incorporate smart thermostats and electrical panels, EV charging, solar, and batteries)

Limitations

The survey covered buyers aged 18 to 60. Almost all respondents (99%) had some college education or more. Households earning under $75,000 make up 2% of the weighted sample, compared with 18% of buyers in the NAR benchmark, so the findings mainly describe buyers with household incomes of $75,000 or more.

Respondents came from an opt-in online panel. The sample was weighted to NAR benchmarks for age, region, gender, and income, but weighting cannot correct every way an opt-in sample may differ from all buyers, and a non-probability sample has no conventional margin of error. First-time and repeat buyers were weighted equally, so the figures describe the buyers surveyed and are not national estimates.

Excluding screening and demographic questions, the survey asked 36 questions covering 214 items. Three of these questions (Q2, Q12, and Q24, 28 items) asked buyers whether they agreed with statements or how well statements described them, covering what they want from a home, the buying process, and their own decision style. Statements of this kind tend to draw more agreement than disagreement, particularly when they are uncontroversial or flattering. The survey also asked buyers to rank the five performance dimensions (Q15) and to choose four of 12 factors in choosing a home (Q15Top3), which measure how they weigh items against each other. Both came directly after respondents read Pearl’s descriptions of the five dimensions, which may have raised the share choosing those dimensions in Q15Top3.

Six questions (26 items) asked buyers about a home performance score and related performance information described in the survey: how valuable it would be (Q14), how useful (Q16), what would make them trust it (Q17), how likely they would be to use it (Q18), how likely they would be to trust it if a given professional recommended it (Q21), and whether they would prefer a buyer’s agent who provided objective performance information (Q21b). Pearl included them to inform product development. They measure stated interest in a concept described to the respondent, and stated-preference questions can overstate enthusiasm compared with what people later do. On Q14 and Q16, between 80% and 91% of buyers gave one of the two most favorable answers, and between 1% and 3% gave one of the two least favorable. Findings that draw on these questions report buyers’ reaction to the concept and should not be read as measures of demand.

The focus groups and interviews were held with recent buyers in the metro Atlanta area. They help explain why buyers answered the survey as they did, but they cannot show how widely a view is held.

Focus groups and interviews (2026)

Three 90-minute focus groups with 18 recent buyers of single-family detached primary residences were held in metro Atlanta on June 25, 2026. The groups discussed participants’ recent home purchases and their reactions to a prototype report of home performance information for a specific home. Ten participants were then interviewed individually, online, from July 13 to 15, 2026. Qualitative findings are exploratory and not statistically generalizable.

Sources

  1. Rose Quint, “Outdoor Features & a Laundry Room Among Most Wanted Features,” Eye on Housing (National Association of Home Builders), April 3, 2024, https://eyeonhousing.org/2024/04/outdoor-features-a-laundry-room-among-most-wanted-features/.
  2. Reuven Sussman, Christine Kormos, Celine Park, and Emma Cooper, Valuing Efficiency by Clicking on Energy Efficient Real Estate Listings: A Controlled Experiment (Washington, DC: American Council for an Energy-Efficient Economy, August 2020), https://www.aceee.org/research-report/b2002.
  3. Smart Energy Consumer Collaborative, Home Buying in the Energy Transition (Smart Energy Consumer Collaborative, June 2026), https://smartenergycc.org/home-buying-in-the-energy-transition-report/.
  4. National Association of REALTORS®, 2025 REALTORS® Residential Sustainability Report (Washington, DC: National Association of REALTORS®, September 2025), 8, https://www.nar.realtor/sites/default/files/2025-09/2025-realtors-residential-sustainability-report-09-30-2025.pdf.
  5. Building Performance Institute, ANSI/BPI-1100-T-2023 Home Energy Auditing Standard (Saratoga Springs, NY: Building Performance Institute, 2023), sec. 1, https://bpi.org/__cms/docs/ANSI-BPI-1100-T-2023_Home_Energy_Auditing_Standard_2023-06-06.pdf.
  6. U.S. Department of Energy and U.S. Environmental Protection Agency, Home Performance with ENERGY STAR Sponsor Guide and Reference Manual, version 1.5 (Washington, DC: U.S. Department of Energy, n.d.), https://www.energystar.gov/ia/home_improvement/downloads/HPwES_Sponsor_Guide_v1-5.pdf.
  7. Jessica Lautz, “Top 10 Takeaways from NAR’s 2026 Profile of Home Buyers and Sellers,” Economists’ Outlook (National Association of REALTORS®), November 5, 2026, https://www.nar.realtor/news/economists-outlook/top-10-takeaways-from-nars-2026-profile-of-home-buyers-and-sellers.
  8. Real Estate Standards Organization, “Property,” RESO Data Dictionary 2.0, last revised September 10, 2019, https://dd.reso.org/DD2.0/Property/.
  9. Jeffrey Raskin, “The $230K AI Repair Estimate That Almost Killed My Deal,” Inman, August 3, 2026, https://www.inman.com/2026/08/03/the-230k-ai-repair-estimate-that-almost-killed-my-deal/.
  10. Chihoon Cho, Richard Frankel, and Xiumin Martin, “Information Reliability and Market Outcomes,” Management Science 70, no. 9 (2024), https://doi.org/10.1287/mnsc.2021.03758.
  11. Federal Trade Commission, “Used Motor Vehicle Trade Regulation Rule,” 81 Fed. Reg. 81664 (November 18, 2016), https://www.govinfo.gov/content/pkg/FR-2016-11-18/pdf/2016-27694.pdf.
  12. Experian, “Vehicle Detail Pages with a Free Vehicle History Report Have Higher Lead and Sale Conversion Rates,” Experian Insights, March 15, 2022, https://www.experian.com/blogs/insights/vehicle-detail-pages-with-a-free-vehicle-history-report-have-higher-lead-and-sale-conversion-rates/.
  13. Cotality, “75% of Homebuyers Expect AI in Process but Still Want ‘Human in the Loop,’” press release, April 16, 2026, https://www.cotality.com/press-releases/75-of-homebuyers-expect-ai-in-process.

About Pearl

Founded in 2013, Pearl is a ratings and standards company building the national standard for home performance. Pearl SCORE™ rates every single-family home in the U.S. across five key pillars — Safety, Comfort, Operations, Resilience, and Energy — so homebuyers, homeowners, and real estate professionals can understand how a home performs in daily life. As a Certified B Corporation, we’re accountable not only to our shareholders, but also to the homeowners and communities we serve. For more information, visit pearlscore.com.

Media inquiries: pearlscore.com/newsroom

Cite this report as: Pearl, The Home Performance Gap, November 2026.

The Pearl logo — a navy house symbol above the "Pearl" wordmark.